Look, I know...perma-bear blah blah blah.
But this is crazy stuff.
There are 2 days in history like today, when the S&P 500 $SPY rallied at least 1% to within 1% of a new high, and more of its stocks fell to new lows than highs.
• Jul 23, 1929
• Dec 21, 1999
We've never in almost 100 years seen breadth this bad.
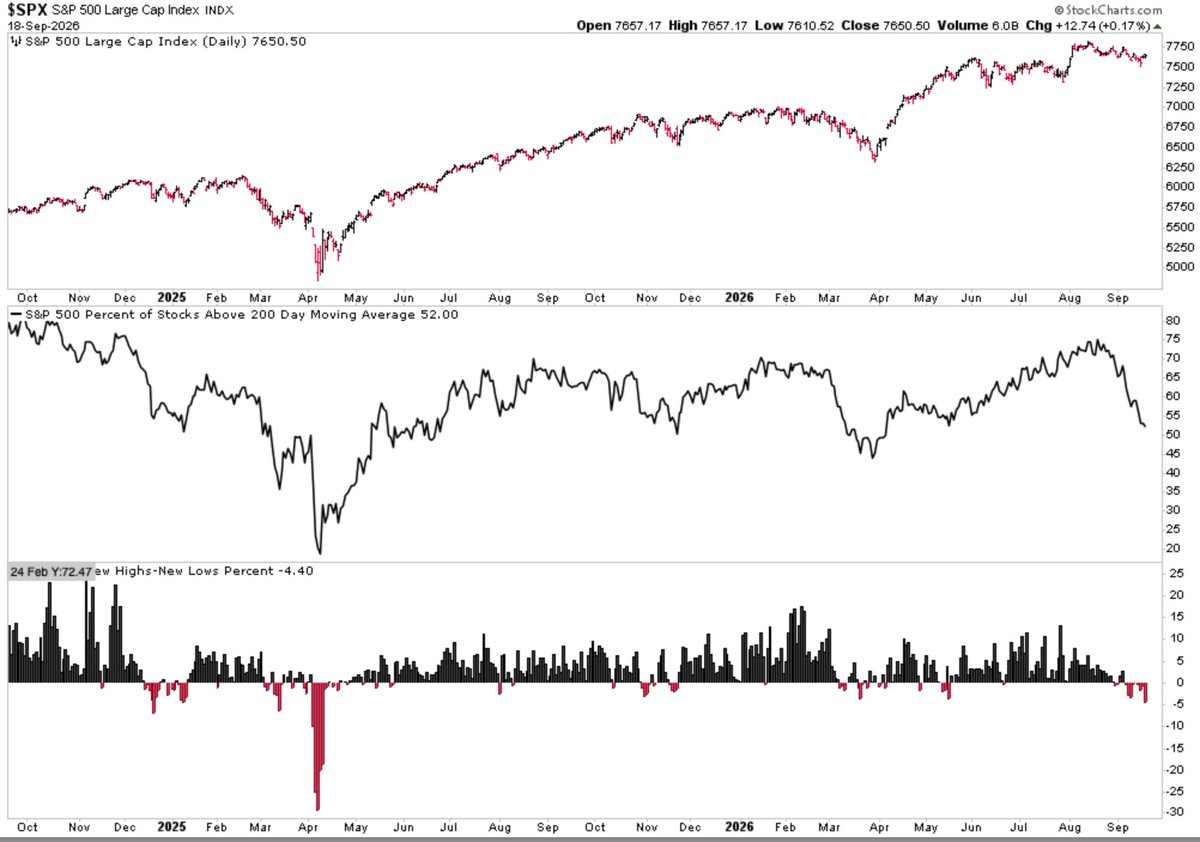
The S&P $SPY is knocking on new highs but there are (many) more stocks at lows than highs.
The percentage of stocks in long-term uptrends is plunging.
The only remotely similar setups were January 1973 and November 1999.
$SPY at highs / $HYG at lows. The setup is back.
The last 5 times stocks sat within 1% of its 52-wk high while Junk Bonds sat within 1% of its 52-wk low, the next quarter lagged 4 of 5 times. Median: -3.5% vs. +3.7% typical. n=5.
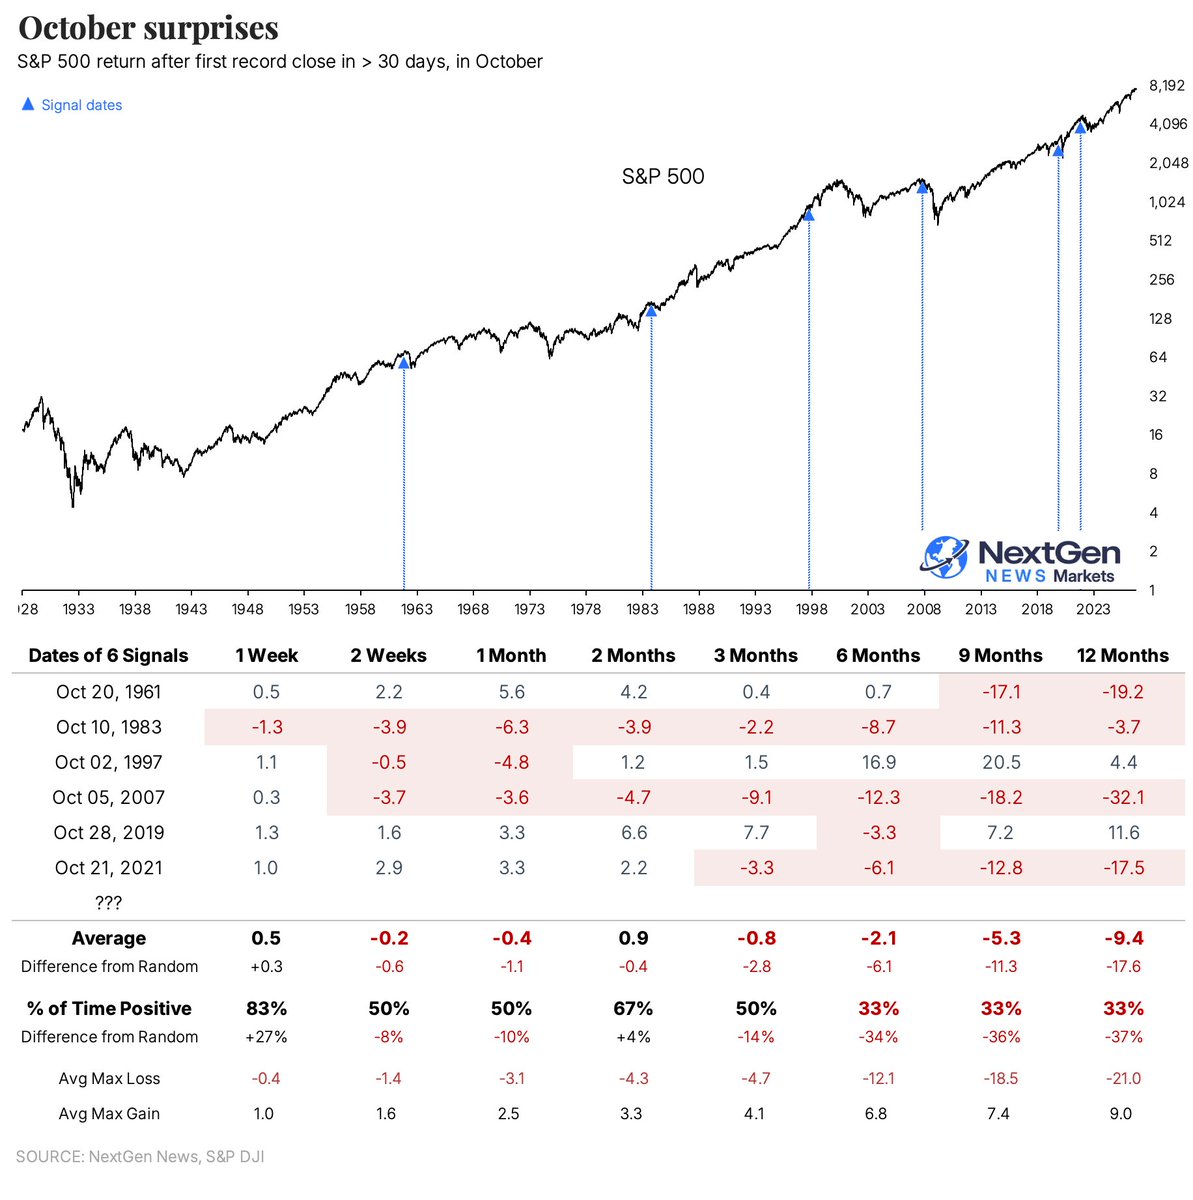
S&P 500 $SPY closed at a record high.
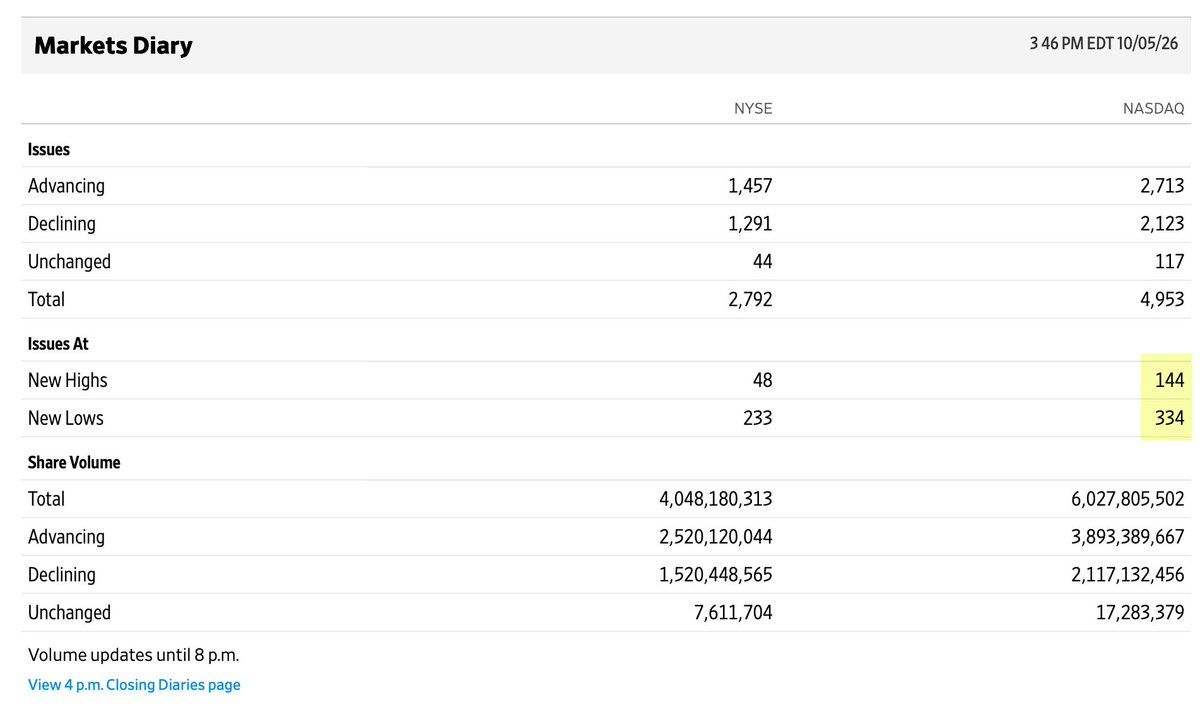
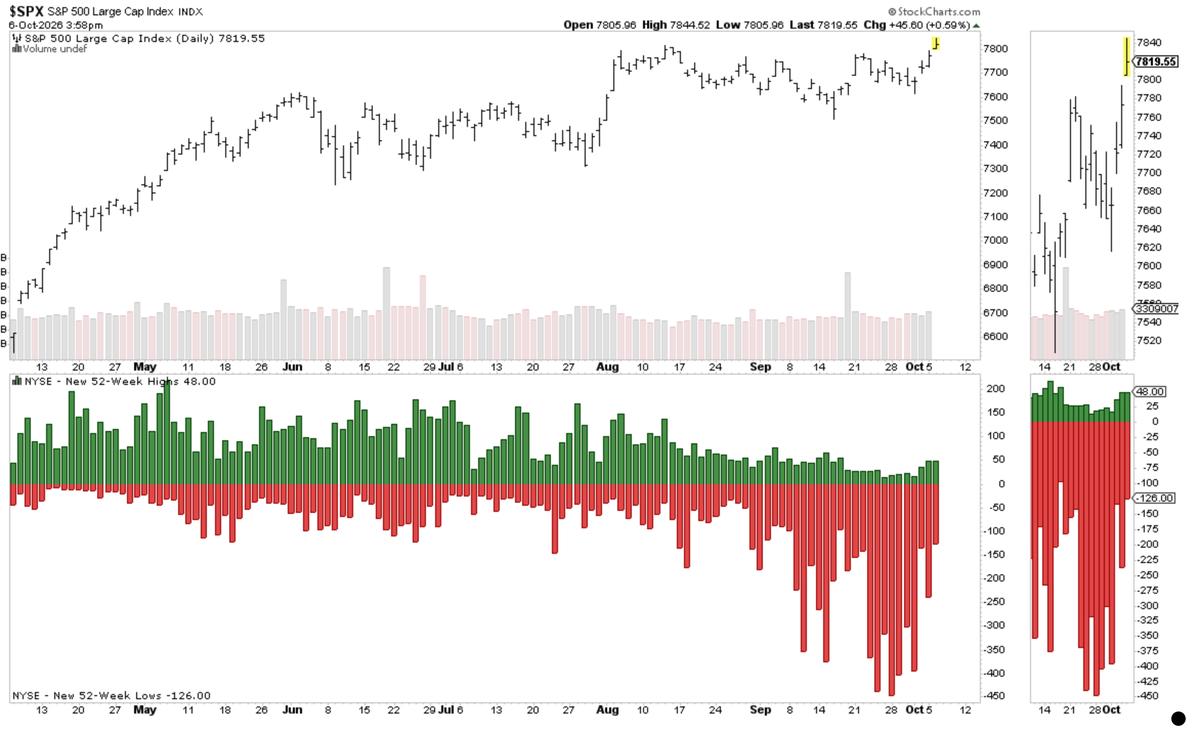
With twice as many lows as highs on the NYSE.
Here's every date the S&P closed at a record and the NYSE low/high ratio was > 2:
6/22/29...2.1
12/3/99...2.0
12/21/99...4.2
12/22/99...4.1
12/23/99...2.3
12/29/99...2.4
10/6/26...2.6
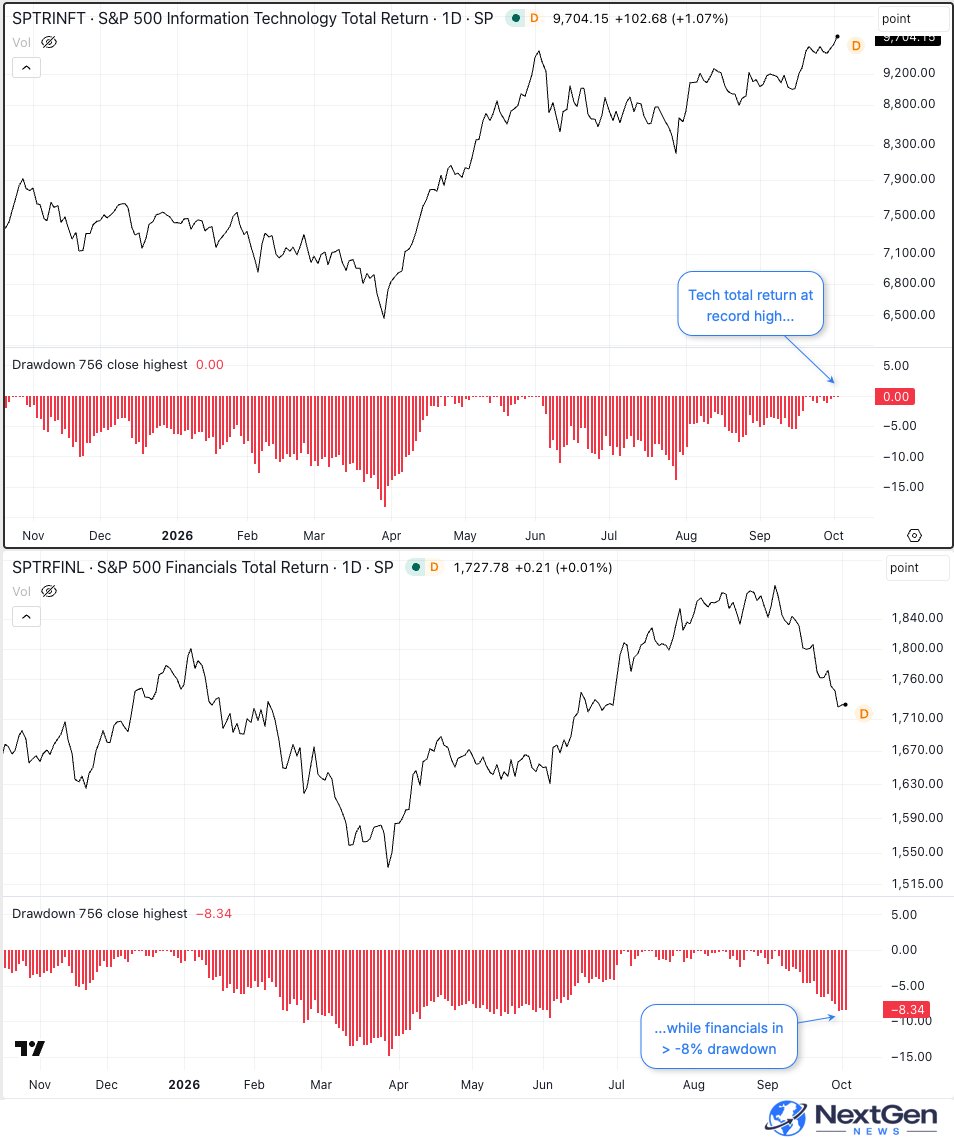
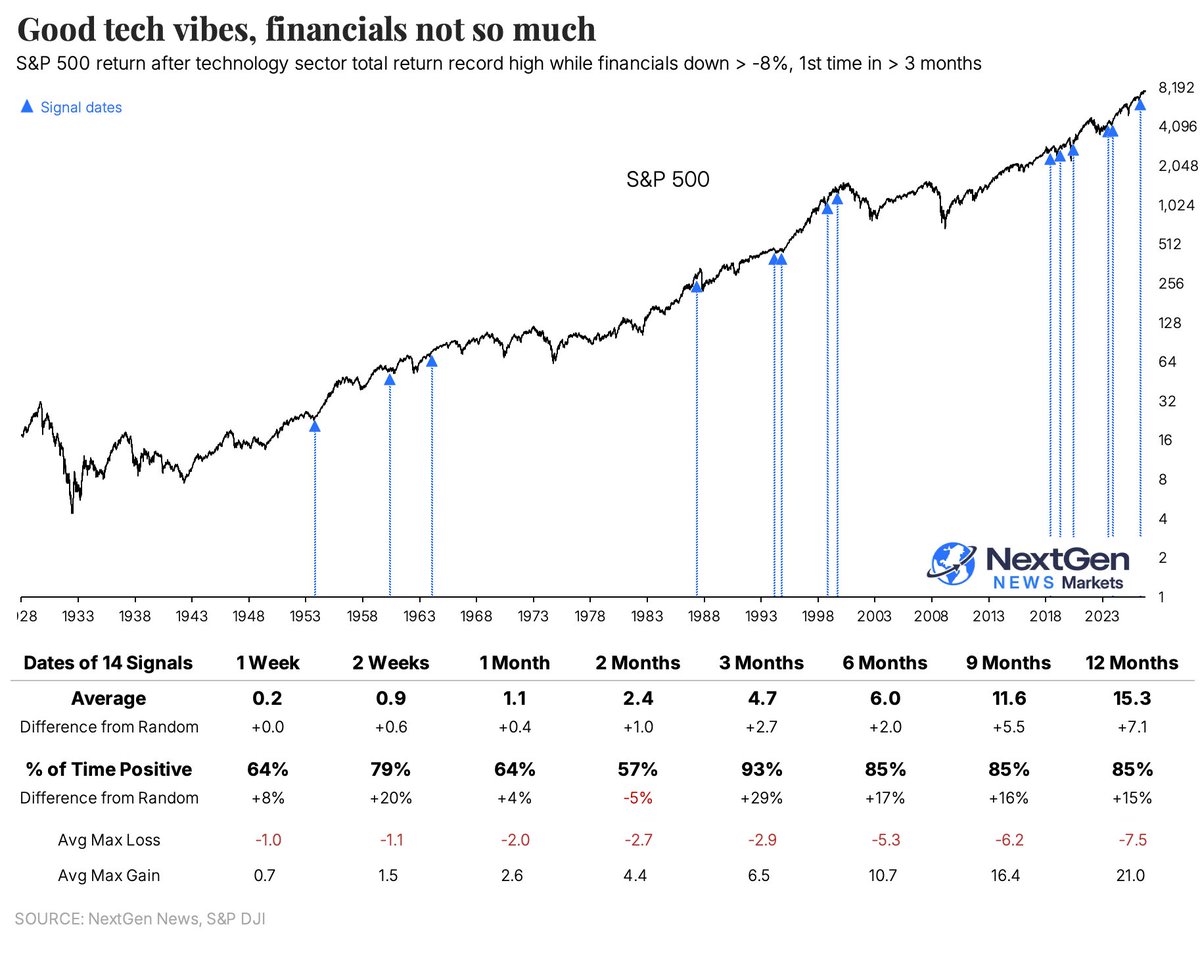
The total return on the S&P's tech index just hit a new high, yet financials are almost in correction territory.
There was similar stress ahead of the '87 crash and 2000 bubble peak.
But those took months to play out, and were the exceptions.
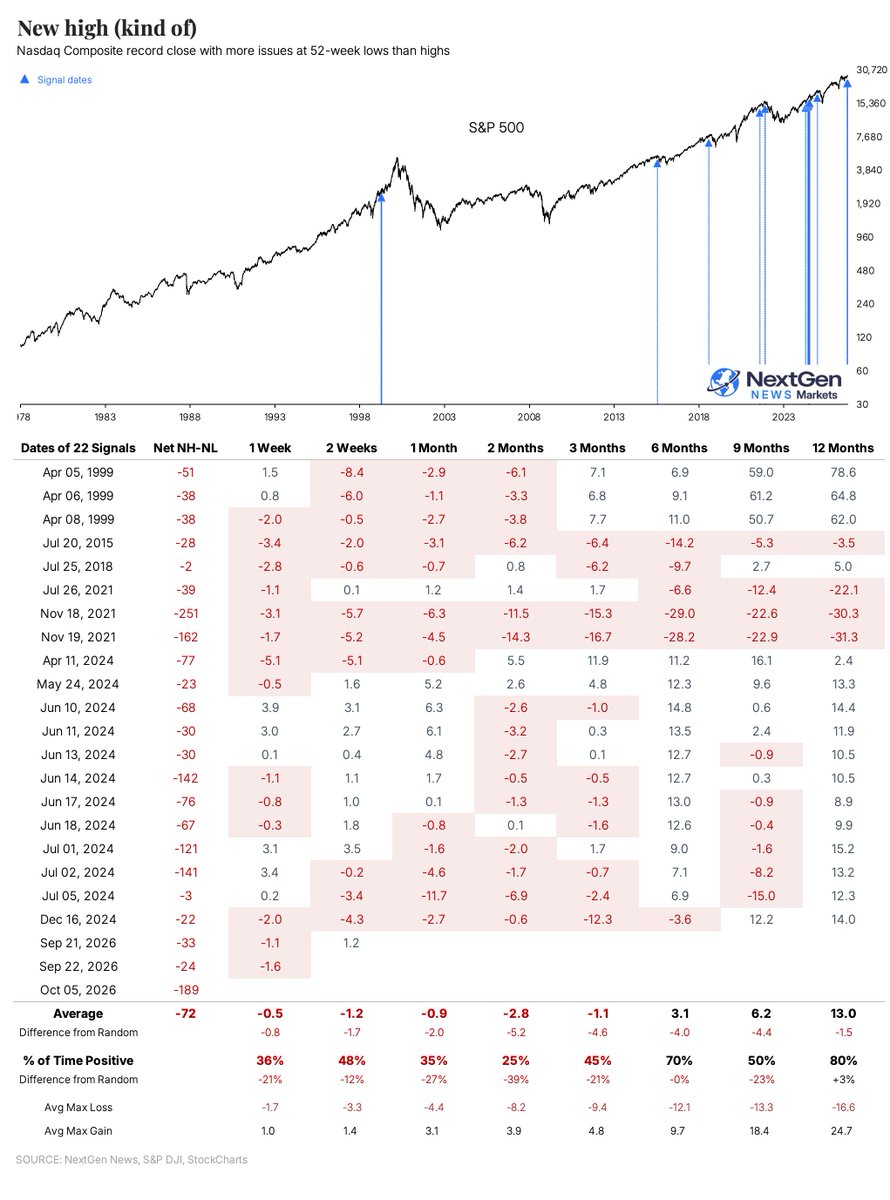
The Nasdaq closed at a record high.
With almost 200 more issues at 52-week lows than 52-week highs.
That's the 2nd-most ever at a record close, next to November 18, 2021.
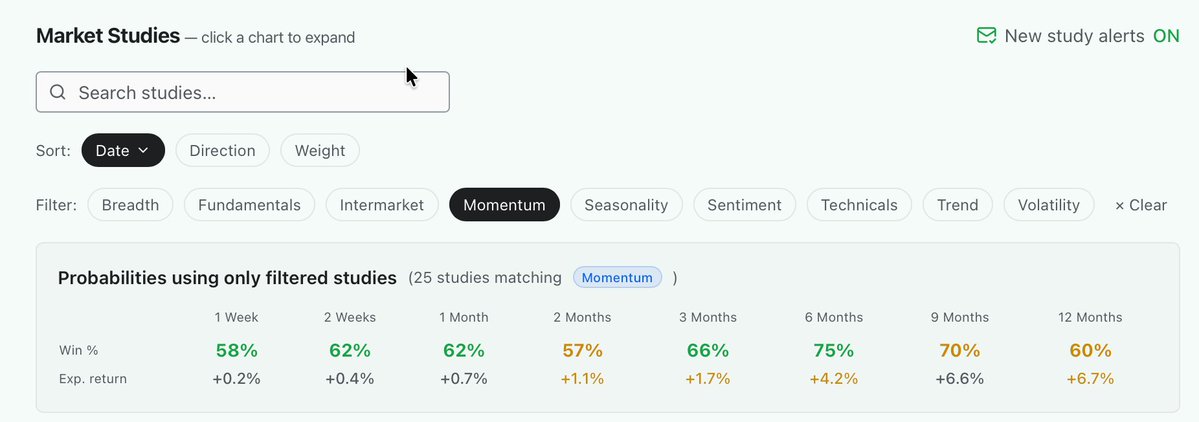
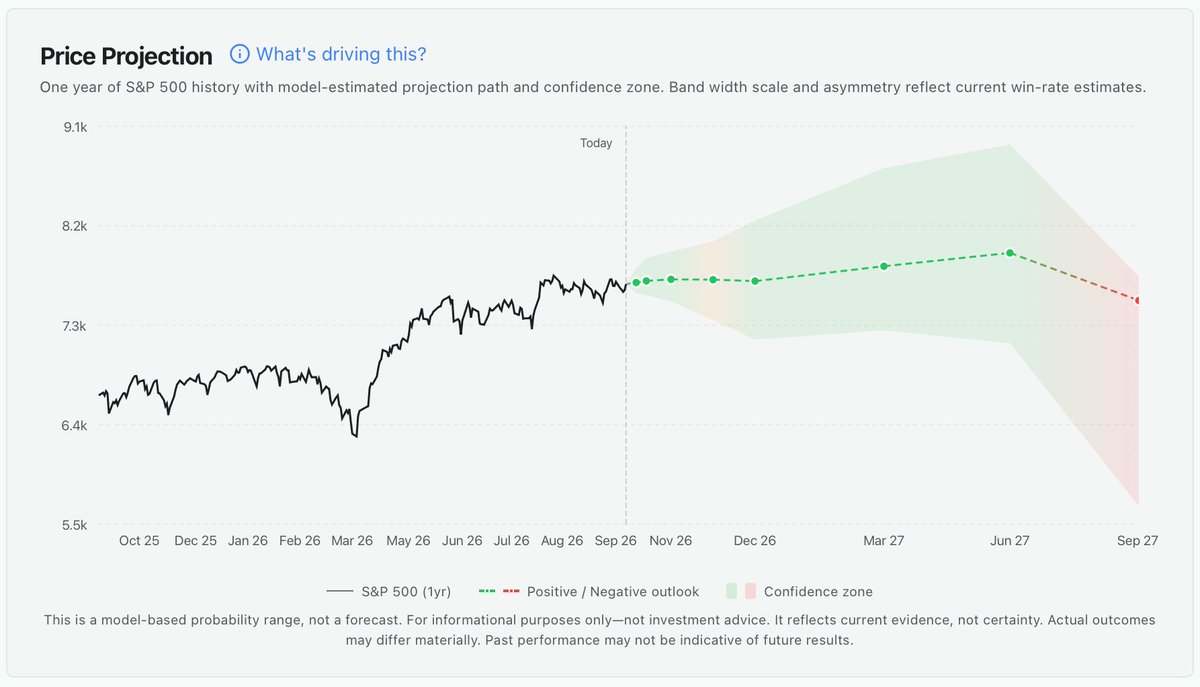
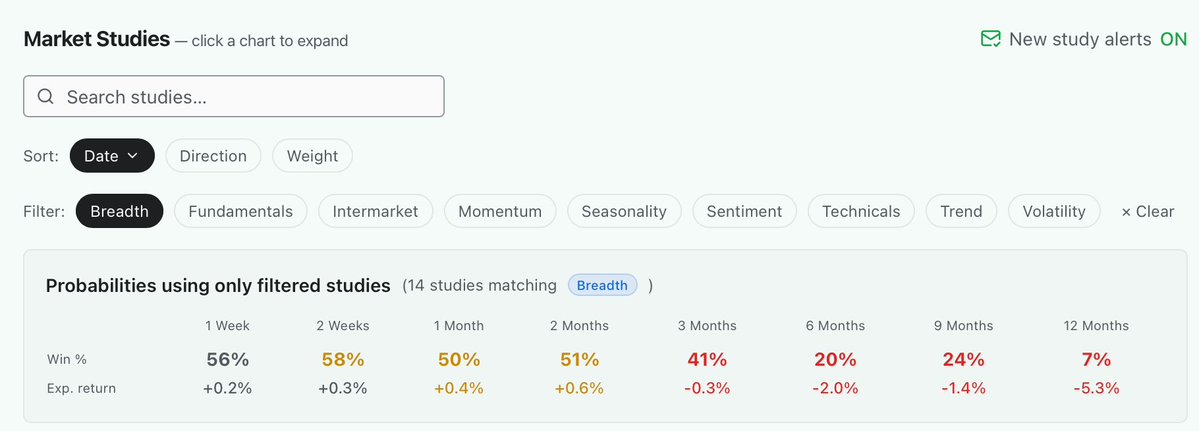
Based on stocks' historical tendency to rise, regime context, and episodic studies, the S&P price projection is decent for a while, but poor long-term.
The main (only) culprit is breadth. It's been horrid, and when it occurs under the surface, has been bad for forward returns.
@ColinACody In the late 1990s, yes, there were several that didn't lead to anything if you reduce the threshold to -600 instead of -700. But it also added a signal in early 1981 before a 25% loss.
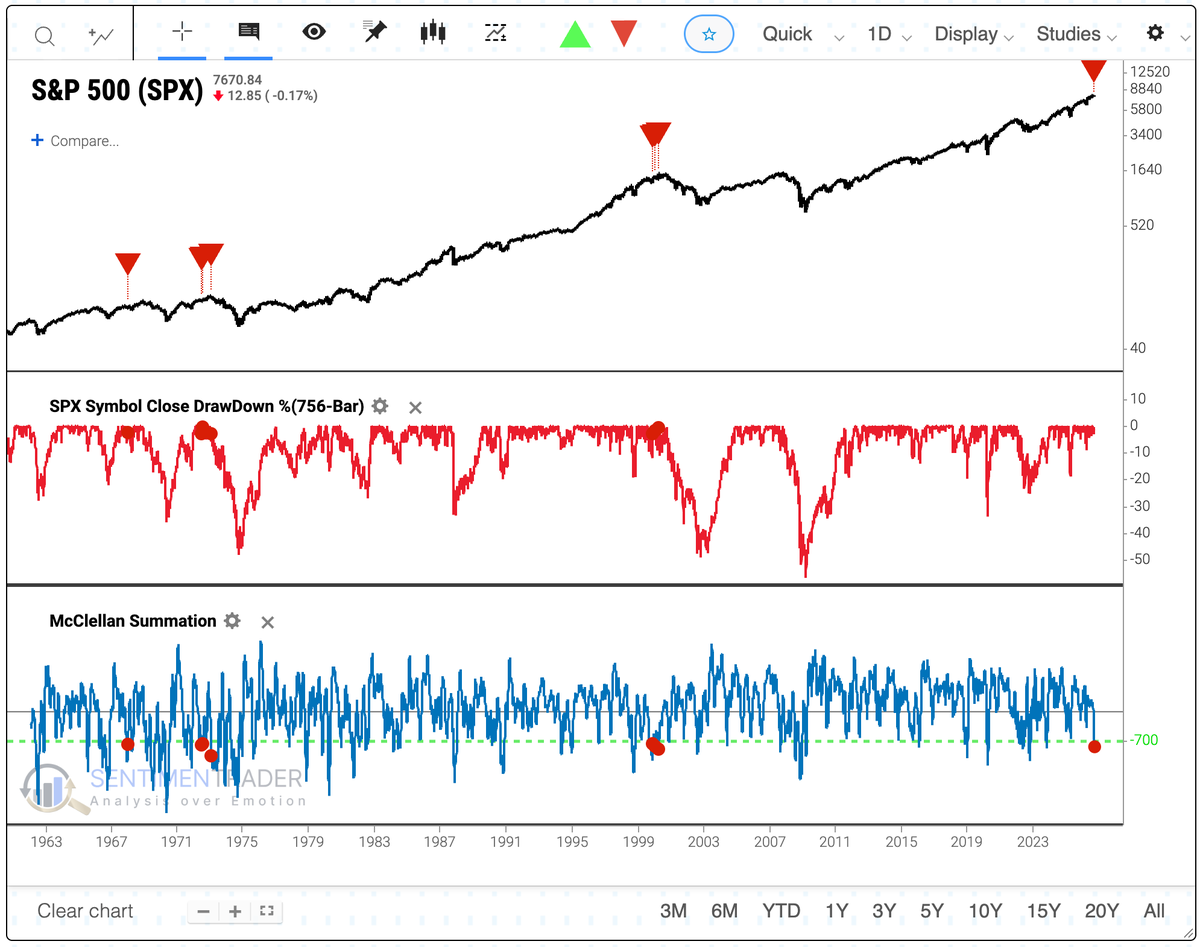
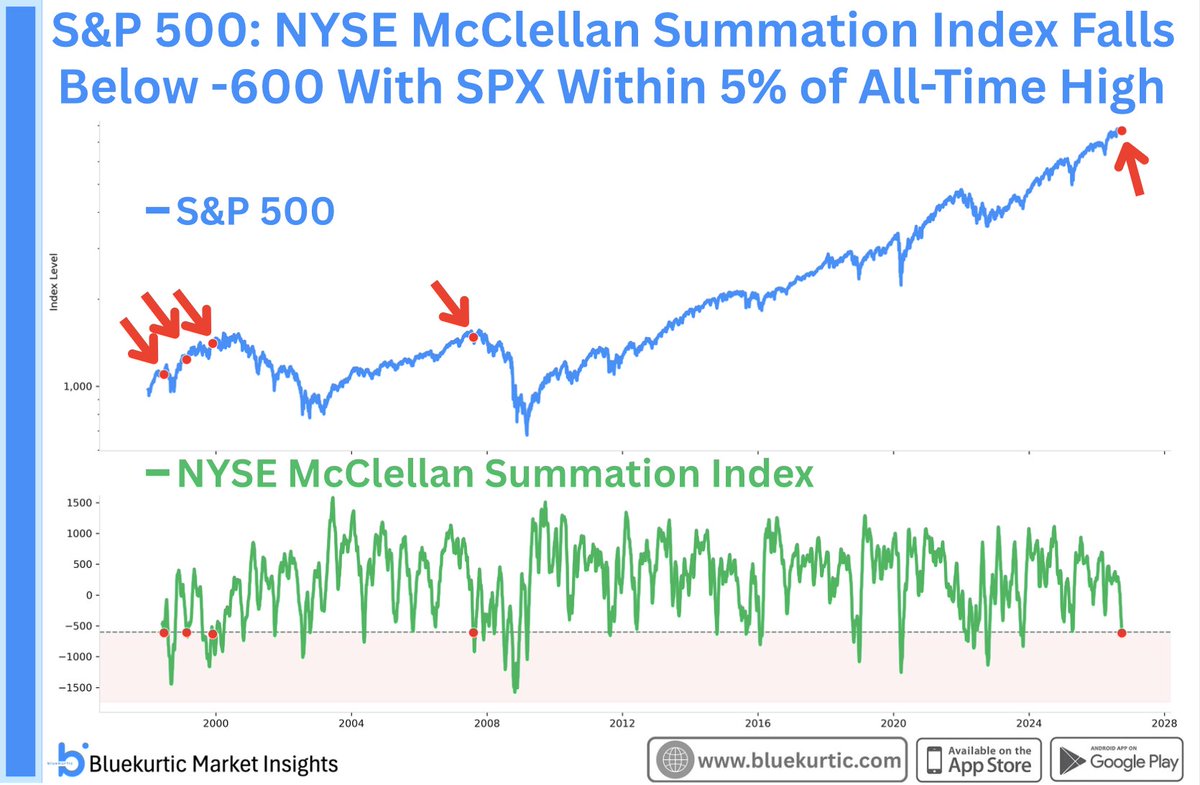
Place this on the ugly side of the table. NYSE McClellan Summation Index fell to its lowest level in over 2 years while the S&P 500 is within 5% of its all time high.
Only other times this happened were in the days leading up to the dot com bubble and the 2008 GFC.
"My data doesn't show that."
All data providers are different due to access or methodology. Test your own.
The most important part is being consistent so you're not bouncing from data to data trying to prove a point.
"You're always bearish so this is just cherry-picking."
LOL. You either can't read, your scrolling thumb is broken, or you're a troll.
And sometimes things don't work. Other times, I'm just plain wrong. That's markets.
Note that the 70% level is pretty stretched and can be considered mildly oversold.
The S&P has most often rallied after readings like this.
It's what comes after - IN A SIMILAR CONTEXT - that is the biggest message.
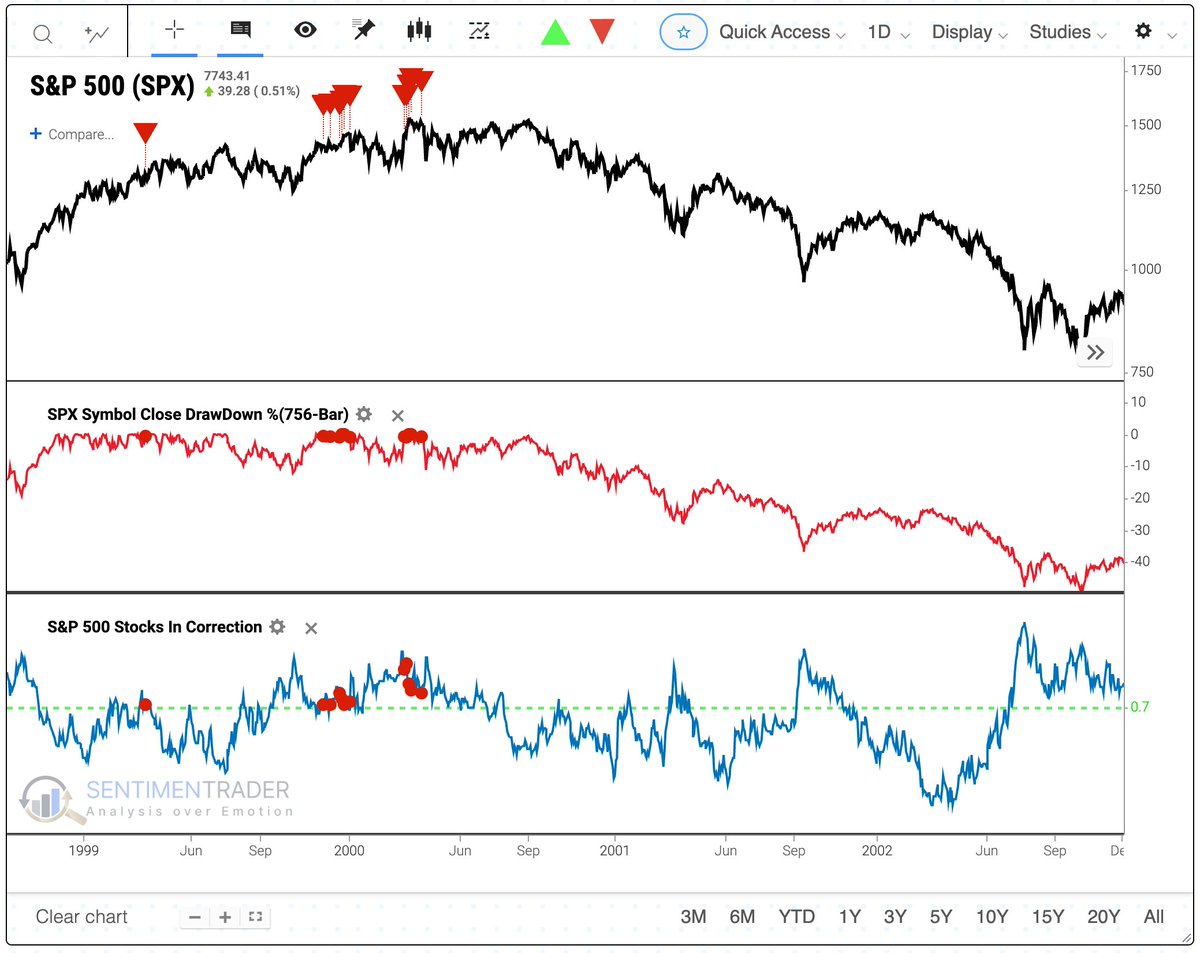
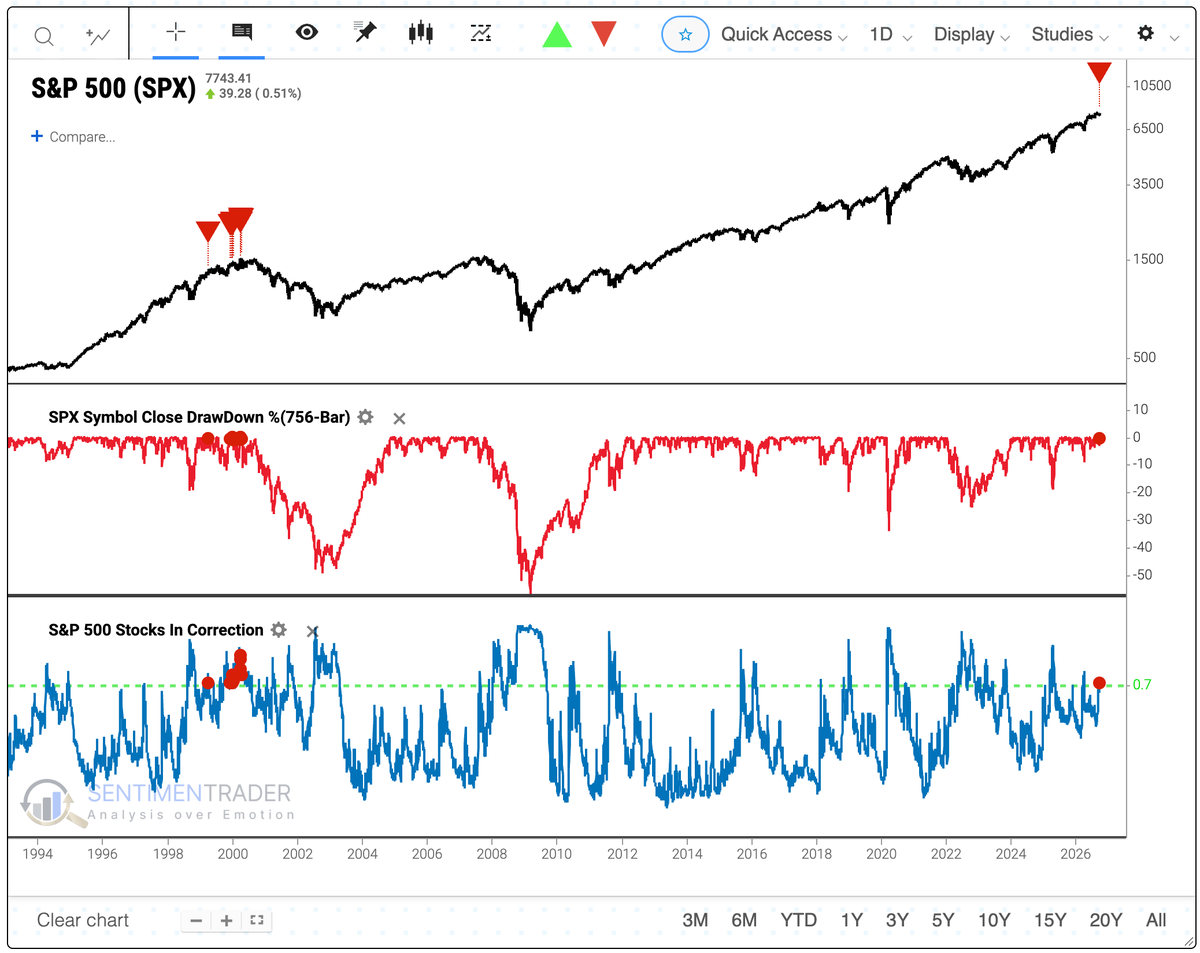
The S&P 500 $SPY has been holding within 1% of a new high.
More than 70% of its stocks are at least 10% below their own highs.
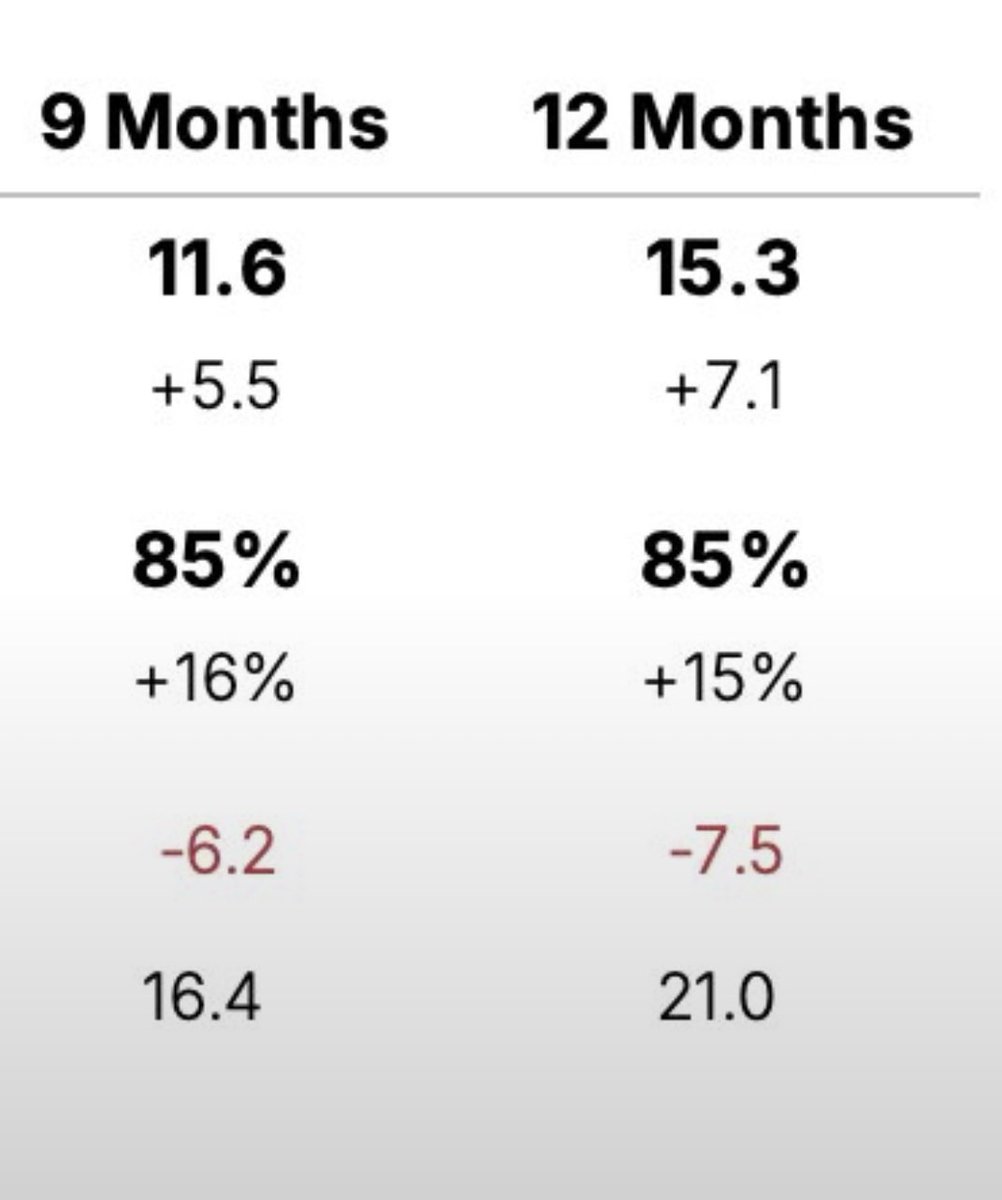
Here's every other time it happened in the past 30 years.
@PeterLBrandt@fleckcap@RevShark Hey Peter - less and less, trying to reduce our time near the craziness of Hennepin County. Spending a lot more time up by your old haunt near Gull.
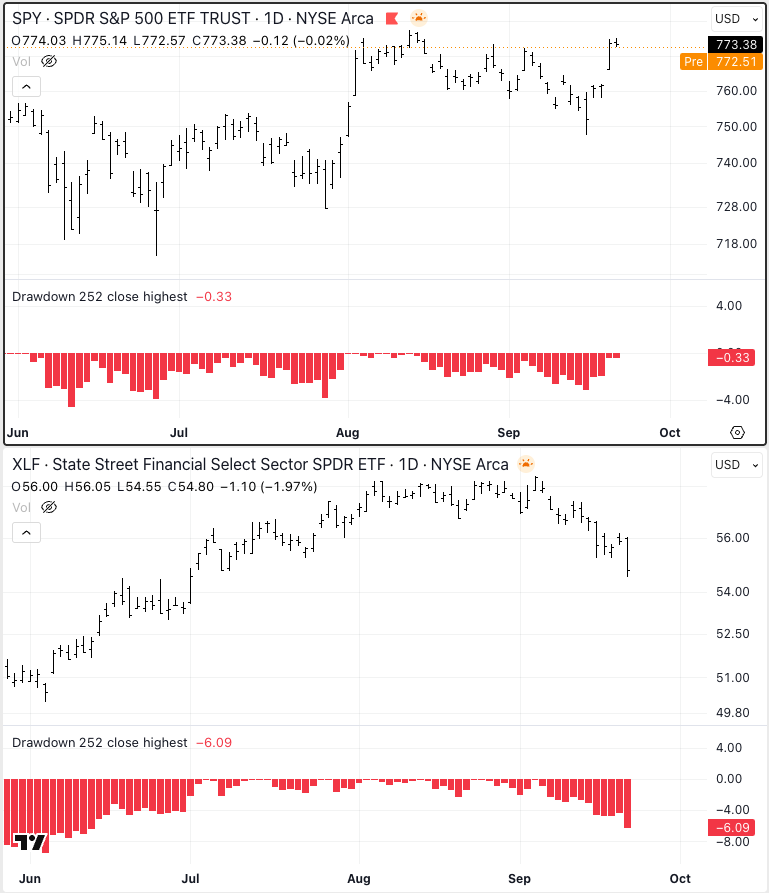
Depends on the definition of "banks," but financials in general are off about 6% as the S&P $SPY nears a new high.
This is an "almost necessary but not sufficient" warning sign.
It triggered before almost every major decline...but too many false signals in between.
FUN FACT 🚨: Banks are down more than 10% from a 30-day high while the S&P 500 is less than 1% away from an all-time high ✅ The last time this happened was January 2000, 2 months before the Dot Com Bubble Burst 👀