.@planet captured high-res imagery of the devastating floods in Libya as a result of storm Daniel, where a catastrophic chain of events caused the collapse of multiple dams.
We’re actively working to provide data to aid in response efforts. https://t.co/ne3fzerbg0
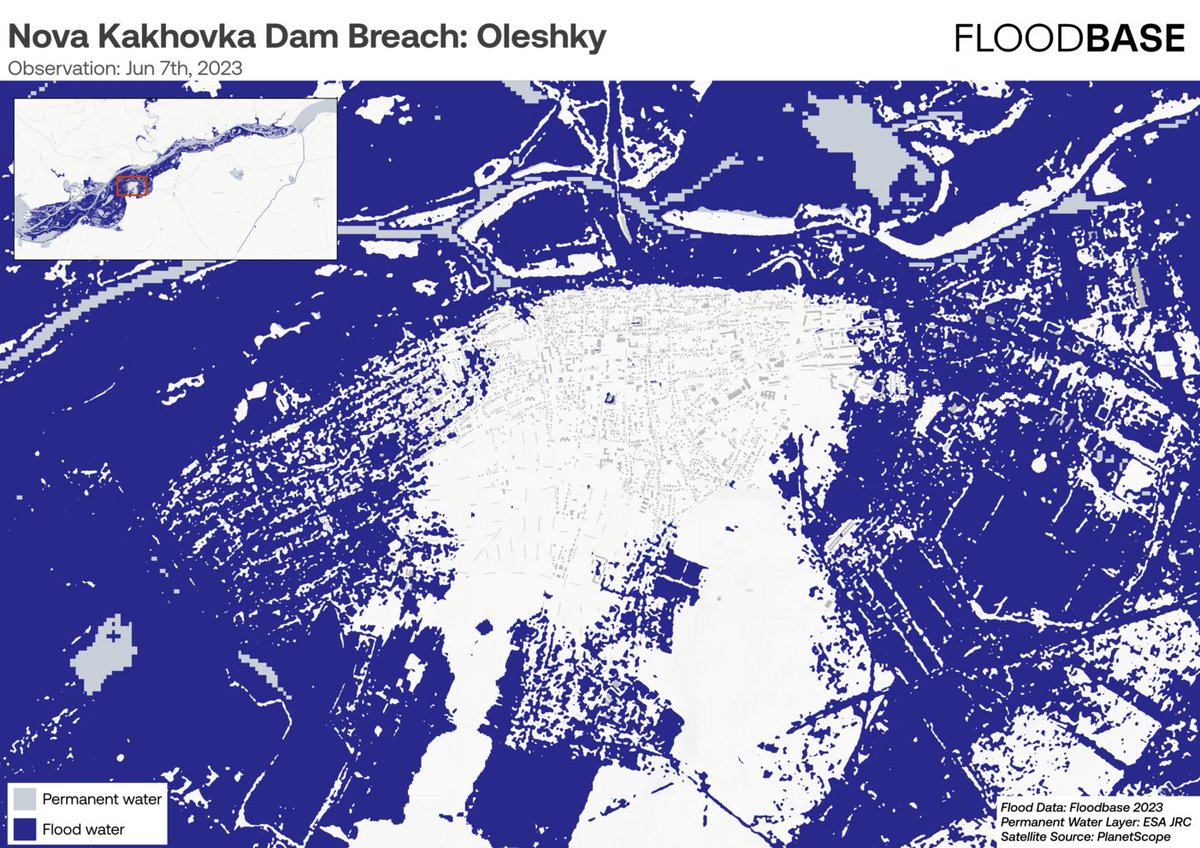
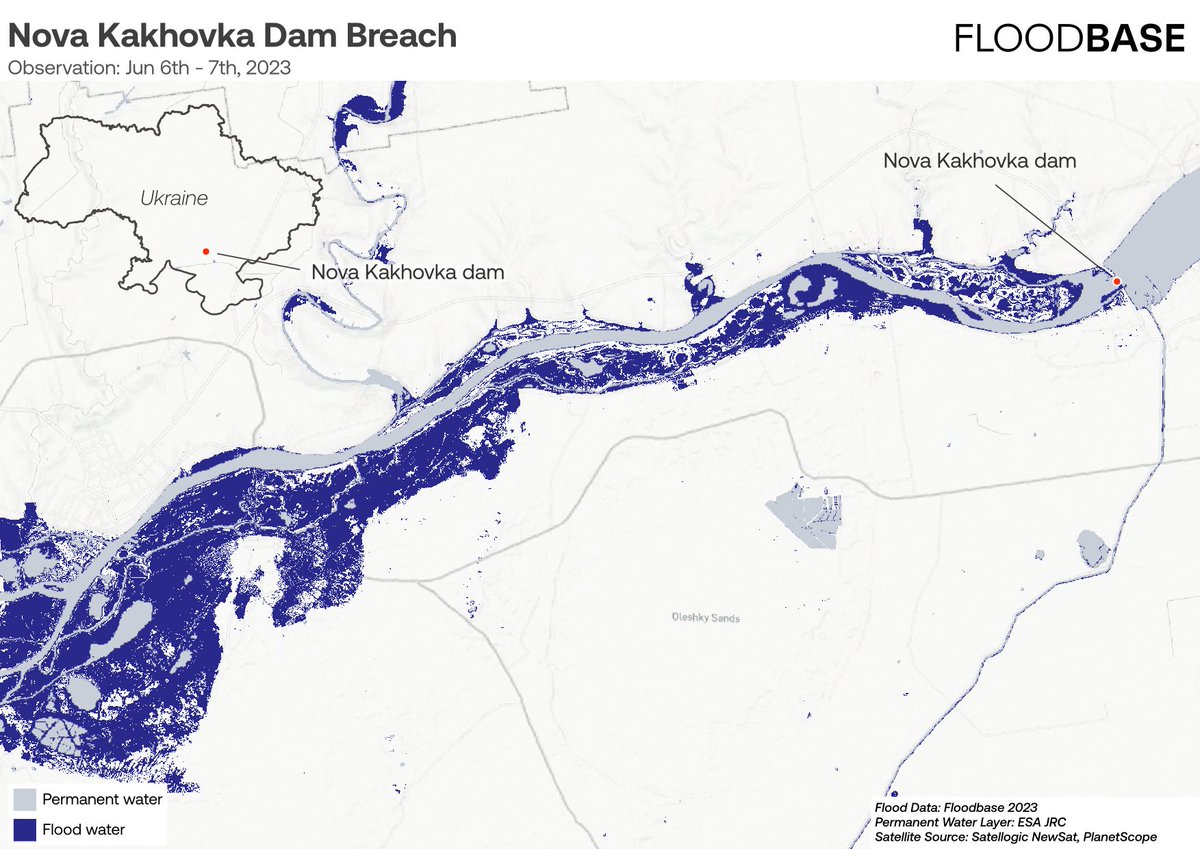
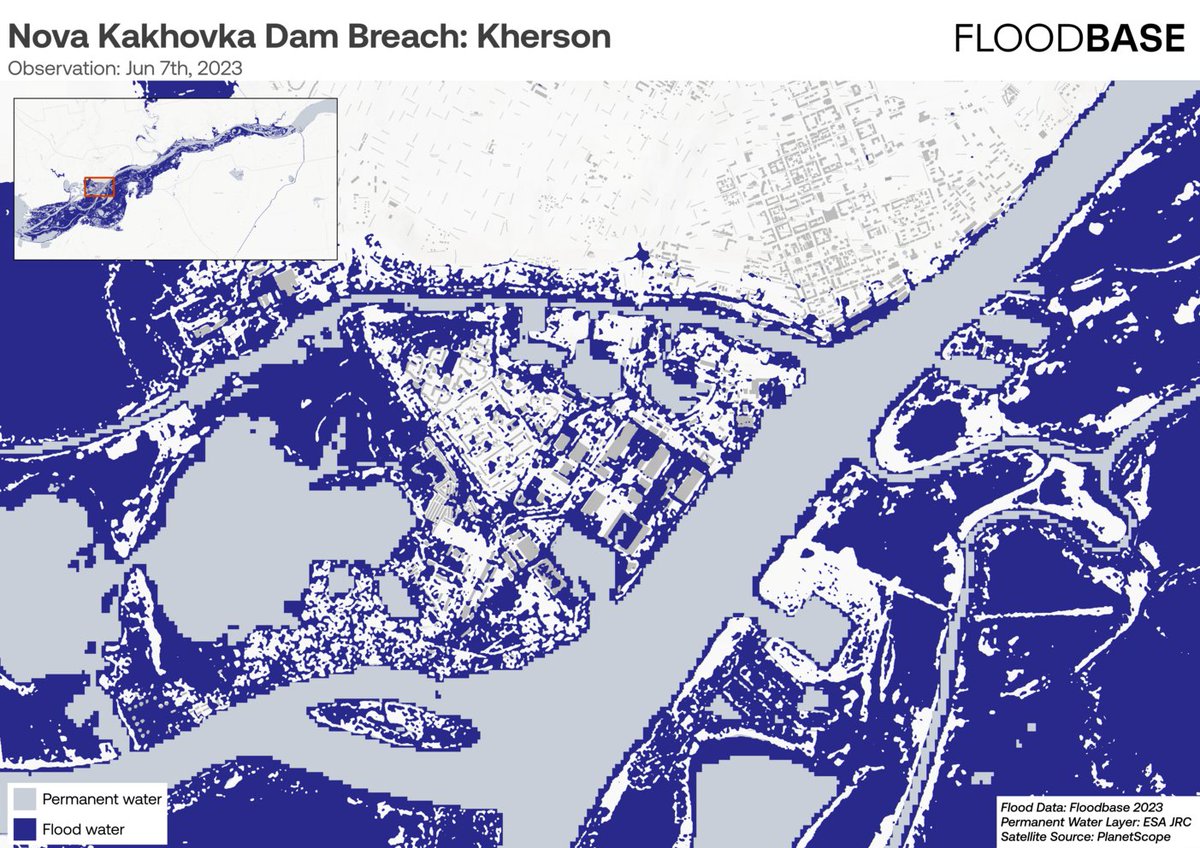
The collapse of the Kakhovka Dam is causing catastrophic flooding across southern Ukraine, flooding over 15,000 homes in the Kherson region.
We’re continuing to monitor the extent of flooding along the entirety of the Dnipro river.
Excited to give an invited talk at the Health Day at #webconf#www2023 on human-AI collaboration and mental health. Come to the talk tomorrow/Monday at 3:40pm.
New feature coming to JupyterLab 🚀
Have you ever wanted to visualize intermediary results of a long-running computation? Unless you launch it in a background thread, it is currently not possible.
JupyterLab will soon offer the possibility to attach a "sub-console" to a notebook!
Hurricane Ian struck Florida with winds up to 155 mph - the fifth strongest hurricane to ever hit the US mainland.
Our maps captured the extent of flooding outside Fort Meyers, FL following the hurricane’s landfall:
Neural networks often pack many unrelated concepts into a single neuron – a puzzling phenomenon known as 'polysemanticity' which makes interpretability much more challenging. In our latest work, we build toy models where the origins of polysemanticity can be fully understood.
A friend just shared this with me. A great example for how deep learning models struggle with out-of-distribution data.
I wonder how many carriages the model has seen during training 😅
@iam_lpettingill@askiggyapp It was easier to do analysis in spark and then make an app in streamlit, rather than try to do the analysis AND app together in hex (at least at the time)
@iam_lpettingill@askiggyapp When we looked into it earlier this year, and not being able to connect hex to s3 directly (at the time - they probably fixed it by now), nor increase the memory/compute of the machine running your analysis, was one reason we didn’t adopt hex.
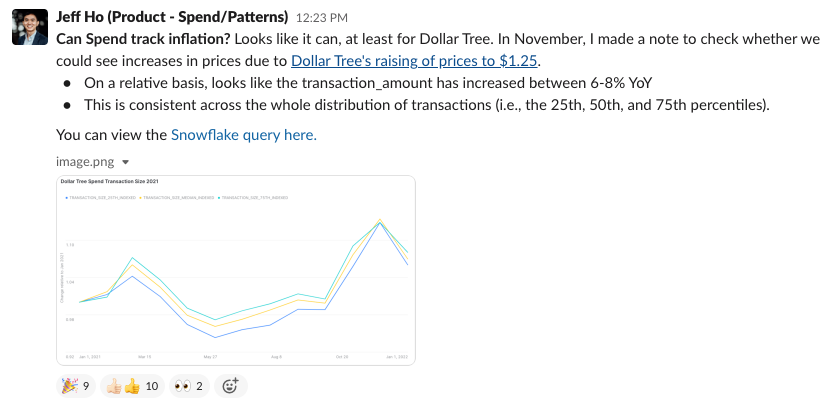
The most fun thing about SafeGraph data is its ability to answer real-world questions. We just published this blog about inflation as measured by SafeGraph Spend, and see evidence that it's resulted in fewer customers at stores with bigger-ticket items: https://t.co/BgZYwEZl26
@thisisniles You could start with the Spyder IDE - it’s closest to RStudio if you use that and will hopefully obscure the most painful parts of Python (environments and libraries).
Alternatively, just spin up a Colab notebook to get started.
6 years ago I joined a 20-person startup.
I wanted to quit after my first week, but didn't.
Now our company is worth over $1B and has 200+ employees.
Here's what I've learned about succeeding at a startup: