🚨 BREAKING: Google Gemini can now analyze any stock like a Wall Street analyst (for free).
Here are 10 insane Gemini prompts that replace $4,000/month Bloomberg terminals:
(Save this 🔖 you’ll need it later)
Mark Minervini’s Position Sizing Principles — Rewritten in a New Way
1. Keep your risk tiny
Every trade should expose only 1.25%–2.50% of your total equity. Small risk keeps you alive long enough to catch the big winners.
2. Your stop-loss is your seatbelt
Never allow a stop-loss wider than 10%. If the trade needs more room than that, it’s not the right trade.
3. Losses must stay small
Your average losing trade should fall in the 5%–6% range. If your average loss is bigger, your system is leaking discipline.
4. No single stock deserves half your net worth
Never put more than 50% of your portfolio into one position — even if it looks perfect. Concentration is good; recklessness is not.
5. Reward your strongest stocks with size
Your best performers deserve 20%–25% position sizes. Strength earns capital.
6. Keep your portfolio tight
Small accounts: 4–8 stocks.
Larger accounts: 10–12 stocks.
Too many positions = no focus, no edge.
7. Rotate like a professional
Move capital out of laggards and into leaders. Weak stocks drain energy; strong stocks compound it.
8. Begin with pilot buys
Start small. Let the stock prove itself. Only increase size when the trade behaves correctly.
9. Let profits pay for your aggression
Add size using market profits, not emotional confidence. Growth should be funded by success, not hope.
10. Adjust exposure based on performance
Trade smaller when you’re out of sync.
Trade bigger when you’re in rhythm.
This is how professionals avoid drawdowns.
11. Don’t diversify yourself into mediocrity
Superperformance comes from selective concentration, not owning everything.
12. Size positions based on volatility
Match your position size to your stop placement. This is “backing into risk” — the art of sizing based on the distance to danger.
13. Reallocate without emotion
If a stock stops moving, shift that capital to something with momentum. Stagnation is a silent loss.
14. Think like a gardener
Feed your winners.
Cut your losers.
Clear the weeds.
Your portfolio grows when you treat it like a living system.
Today’s market strength was textbook. This is exactly what markets do during corrections when they get stretched to oversold levels. As I said just recently, "some of the biggest rallies occur during bear markets and corrections." Today was a perfect example.
Traders rushed in after headlines hit that Iran’s president signaled a willingness to end the conflict with the U.S. The Dow exploded higher by 1,125 points. But let’s not confuse cause and effect. The news may have been the trigger, but the market was already set up for a rally. It was oversold and primed. Now comes the part where discipline matters.
We ignore the first few days of a rally attempt. That’s potential noise. What matters is whether the market can follow through and whether leadership begins to emerge and proper setups develop.
Technically, this is a classic snapback: Indexes that broke below the 200-day are rallying back toward it, while Indexes that held the 200-day are bouncing off it. That’s typical countertrend behavior until proven otherwise.
Expect volatility to remain elevated. That’s not where low-risk money is made, but it's certainly where the risk is. Your job during corrections is simple: identify the stocks showing the best relative strength and the tightest price action. Those are your future leaders when the market finally turns.
On the macro side, nothing has been resolved. Higher crude prices are still a problem. Yesterday’s rally did nothing to materially bring down oil. The bigger issue is still in play and the jury still out. Oil at these levels feeds inflation, pressures growth, and gives the Fed a reason to stay on hold longer. Yields stay elevated in that environment.
To cut through all the noise, I look to the market itself, which has a much better track record of telling us the truth than the politicians, the analysts, the news, and the gurus.
The four steps of the bottoming process are:
1. Oversold – The difference between an ordinary pullback and an oversold condition starts with price, but it does not end there. Poor breadth and and a lack of volume confirmed follow through describe a one-sided market, and one not to trust.
2. Rally – Inevitably, the market bounces from its oversold condition. A high-quality rally is broad-based. A low-quality rally is defined by short covering and driven primarily by the stocks that have declined the most. Again, the character of the rally is important to distinguish. So far, we simply don't have enough data to make a confident determination, so patience is the watch word while we wait.
3. Retest – After the rally, there is almost always a retest. The popular averages approach, and in some cases breach, their oversold lows. The key to a successful retest is less selling pressure, such as fewer stocks below their moving averages, fewer stocks, sectors, and markets making new lows, less total volume, and less downside volume. If the retest fails, the process reverts and we generally start looking for divergences during lower lows. In the event of unexpected news, it is possible for the market to recover in a "V" fashion with no retest. In that case, we look at breadth confirmation and participation.
4. Breadth thrusts – In the final phase, not only do benchmark indices rally sharply with few pullbacks, but they do so with an extremely high percentage of stocks, sectors, and markets participating, or what technical analysts call breadth thrusts. In rare cases, the market has skipped step 3. With strong enough breadth, retests are not necessary. The Covid bottom is an example of a pretty powerful V-shaped recovery.
Bottom line:
This was an oversold rally, sparked by headlines—but not defined by them, and certainly not confirmation of a reliable bottom.
Now we watch:
--Quality of follow-through
--Emergence of leadership
--Market internals and model health
If the rally lacks quality, if economic pressure builds, or if leading stocks begin to deteriorate, then this remains what it likely is—a rally within a correction.
Stay objective. Let the market prove itself. If you are going to trade, do so incrementally.
https://t.co/JXzFFTmMtn
Mark Minervini Setup
How to find stocks
Screen stocks that are within 25% of their 52-week high
Eliminate the following stocks
Eliminate stocks trading below 30
200 MA is rising for at least 3 months
50 MA is above 200 MA
Current price is above 200 SMA and preferably above 50 too
Current price is at least above 100% from 52-week low
The stock should have made a 52-week high at least once every 4 to 6 months
Buying Pattern
Make stock list every week after weekly closing
Use weekly charts
Use Volatility Contraction Pattern (VCP)
Use only Price and Volume
Stocks moving up with good volume and then falling with lower volume (consolidating) is good
Use weekly charts
AMO daily charts are good for seeing setting of the stock
Look for volatility contraction in daily charts (just for looking entry)
You don’t need to find new candidates every day, try to add to existing position
Breakouts should happen between 4–8 weeks
Win rate is only 50%, so be prepared
Post Buying Monitoring
Follow up buying
Green days vs Red days
Up Volume vs Down Volume
Tennis Ball Action
Shallow Pullback
VCP Pattern
Volatility Contraction Pattern (VCP)
To calculate volatility contraction, divide swing low by swing high then -1 gives the % drop in volatility
There should be ideally 3 VCP
Each time volatility should decrease by ideally 50% (not a hard rule)
Buy when the previous swing high is taken out
With volatility, there is also time contraction which is very similar to price contraction
Take a stock for 2 VCP only if the second contraction is more than 70%
Stop Loss Calculation
Plot 20-period ATR on daily chart
Calculate 2× of the above value
Use this value as your stop loss
Use maximum of 10% as stop loss
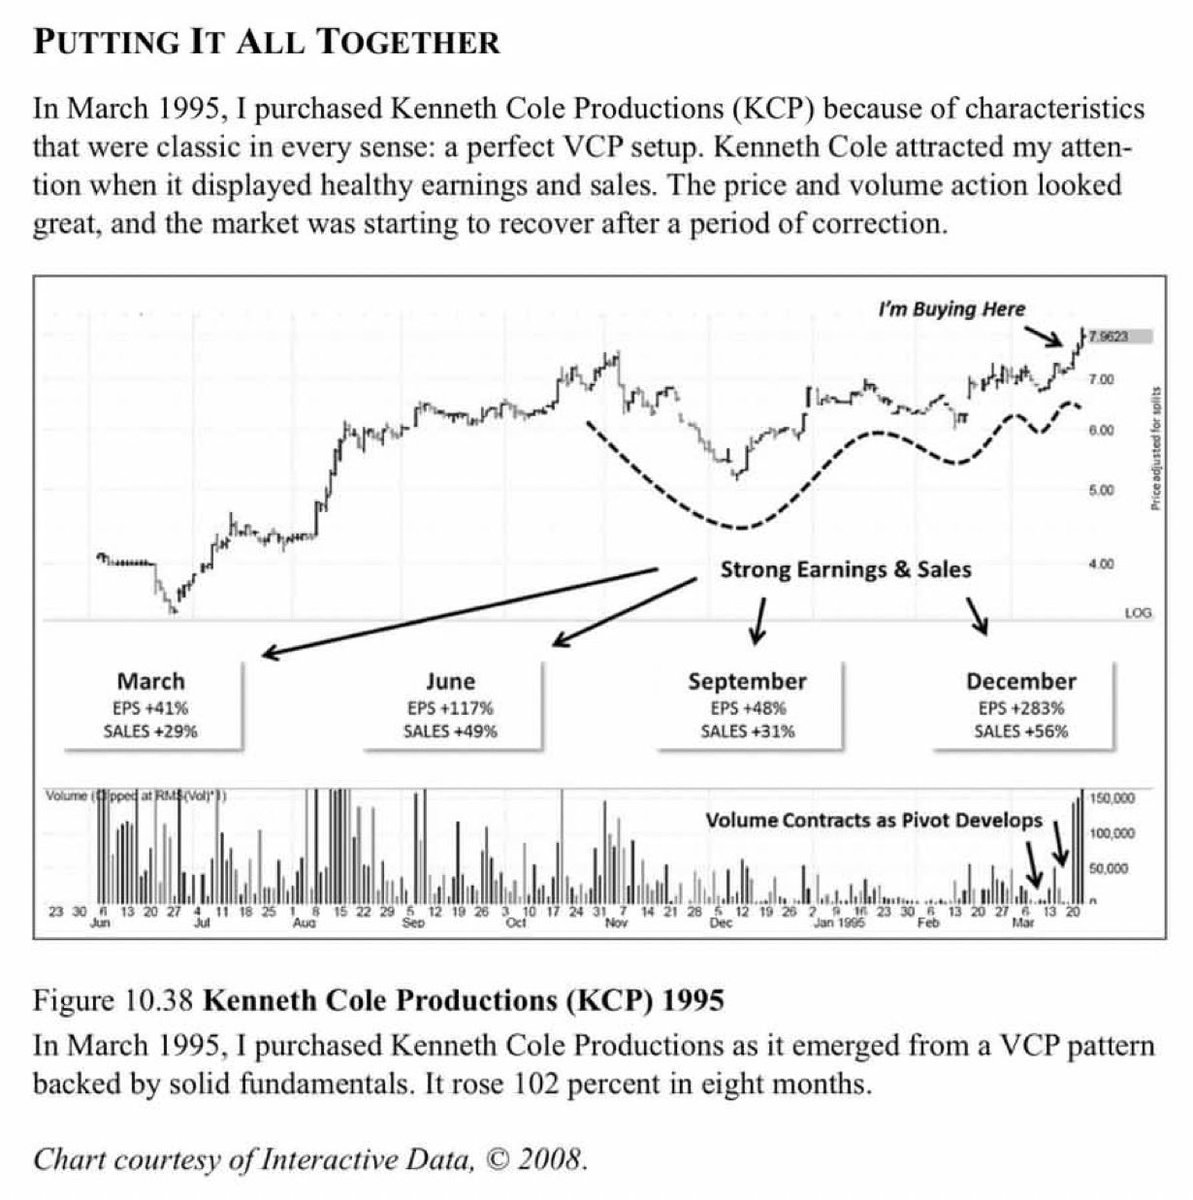
Here’s Mark Minervini coming into the ‘95 uptrend based on what stocks met his criteria. He didn’t get really aggressive until April ‘95 - had an incredible 413% return that year! From ‘Trade Like A Stock Market Wizard’ - Minervini 2013
🤖 BREAKTHROUGH: I just released a revolutionary AI-powered trading indicator that LEARNS from market data!
✨ What makes it special?
Automatically optimizes indicator weights based on REAL performance
Tracks the accuracy of SuperTrend, MA, VWAP & Linear Regression
Adapts to market conditions in real-time
Shows exact performance metrics + improvement over static indicators
⚡ Features:
ML engine with configurable learning parameters
Dynamic weight adjustment based on prediction accuracy
Smart signal generation (Strong Buy/Sell + regular signals)
Comprehensive performance dashboard
4 technical indicators fused intelligently
🎁 FREE INDICATOR: I'm sharing this with everyone who RETWEETS + LIKES this post! More importantly, send a DM mentioning your TradingView ID.
No more guessing which indicators work best - let AI optimize them for you automatically!
🔗 Check it out: https://t.co/jfoTw8Nli9
#TradingView #MachineLearning #TradingIndicator #AITrading #TechnicalAnalysis #Trading #Forex #Crypto #Stocks #Algorithm
🚨 FPL Open League 2025/26 🚨
✅ Free to Join | 🌏Open for All
🔐 League Code: 10ev25
Top 5 prizes - Total £200 + PS5 🔥🔥
🎮 Winner gets a PlayStation 5
💸 Cash Prizes:
2nd – £100 , 3rd – £50 , 4th – £30, 5th – £20
✍️ Complete all steps before GW1 deadline ⤵️
🔹Follow us, Repost & Like this post.
🔹Tag 2 friends in the post with #FPLManagerIndia
🔹Sign up here ➡️https://t.co/4944sHx5if
📥 Join League 🔗https://t.co/9wowCZGA34
Form closes at GW1 deadline. No entries accepted after that.
Good luck, Let’s go! 🏆
#FPL #FPLCommunity #FreeLeague #PlayStation5 #FPLCodes #minileague #FPLPod #Gw1 #PremierLeague #fantasypremierleague #FplManagerIndia #FPLDraft
Stock returns come from two things:
1️⃣ How much earnings grow (EPS growth)
2️⃣ The multiple at which you sell (Exit multiple)
Earnings depend on various factors
Overpaying erodes future returns even if earnings surprise on the upside
Future returns depend on entry valuations—so don’t overpay
Margin of safety helps protect against negative surprises in earnings or multiples
Buying at the right price gives you a big edge over time