$NEAR continues to coil inside a large symmetrical triangle on the 12H chart, with price now approaching the apex of the pattern. 👀
The structure is tightening, and a breakout above the descending resistance trendline could trigger a strong move higher.
Key levels to watch are $2.27 and $2.97, while holding above the rising trendline keeps the bullish structure intact.
The bigger the squeeze, the bigger the move tends to be.
#NEAR #Crypto
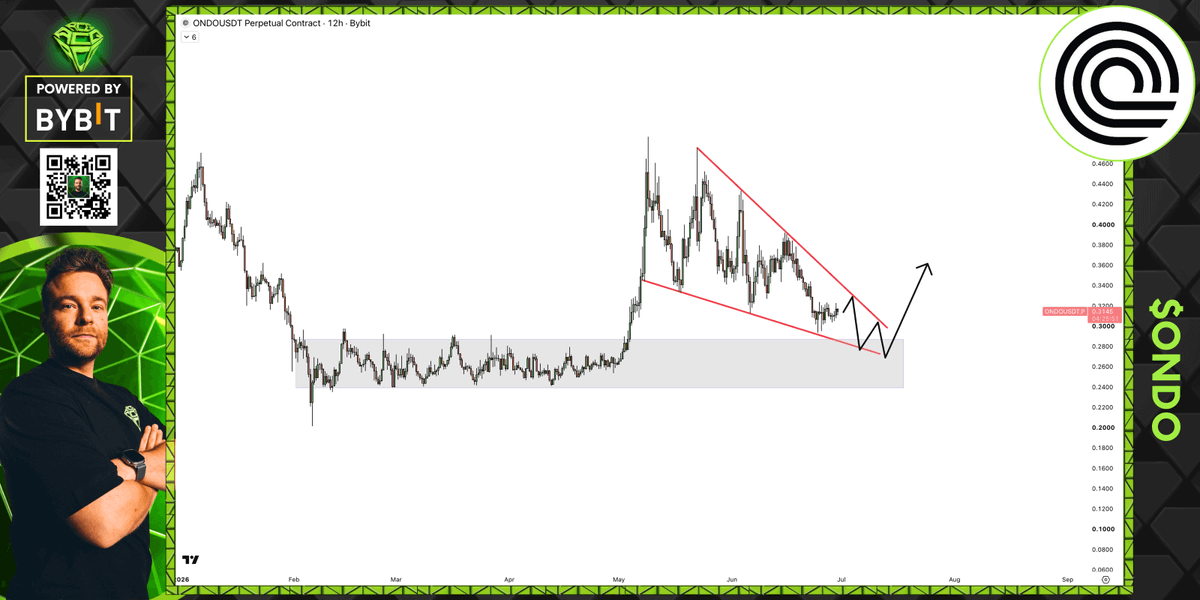
Seems to me that $ONDO is forming a massive falling wedge into a key support level.
If that is the case, it's better to monitor a reaction there; it could be a great buy-the-dip opportunity.
Looks like $BTC is trying to formulate a bottom here around the $60,000 level.
Wanting a bounce towards our most local nPOC prints at $65,683 and $64,316.
EVERY SINGLE $BTC bear market, price has retested the following:
Blue line ✅
Target 4 ✅
Target 5
Cheers to the market snipers waiting to buy the right dip for the past 8.5 months. 🤝
Open interest, simplified
A quick breakdown of what OI measures, how it changes, and how it’s used in futures and options markets.
Read more 👇
https://t.co/rrCAAYzRoX
$BTC 1W
Ideally something like this.
We would have tons of reversal signals & the down/sideways would be a time capitulation rather than a price capitulation.
$BTC update:
Nice +12% recovery (vs 15% I expected).
Price was very overextended and we always see some kind of recovery to the EMAs.
That might have been it. But, if price can reclaim $64k next week, then it's very likely that price makes a new local high (current is $67.3k)
$BTC 1D
Still eyeing the 70k level for our bounce to be completed.
Hourly TFs look good to continue a bit higher. There aren’t any “issues” that I see yet to stop this bounce.
+ our weekly just confirmed another set of macro reversal signals.
$BTC Has moved up further back into its range.
I would not be surprised if we hang around this big area for a few more weeks at least. Especially with Summer coming up and lower liquidity/volatility.
$BTC Has made that market structure break and is now back into a bullish trend on the lower timeframes.
Higher highs and higher lows are being put in.
But to also make a higher high on the weekly structure, you need to pass the $83K high from May.
🚨 BIGGEST MARKET EVENTS THIS WEEK
🇯🇵 June 16 — Bank of Japan Interest Rate Decision
🇺🇸 June 17 — FOMC Interest Rate Decision, Economic Projections & Press Conference
🇬🇧 June 18 — Bank of England Interest Rate Decision
🇺🇸 June 18 — US Retail Sales Data
This is one of the biggest macro weeks of the month.
All eyes are on the Federal Reserve as traders await the next major signal for global markets.
#BTC pretty much has broken the Parabola
The low is now in for the coming months like prior times (It could see a sweep or a test within a few weeks)
Bears may or may not have one last shot in September/October as the June/July weekly cycle low falls on month 44 which IS in the 10% range of the 4 year cycle low (Month 44 of 48)
$BTC Sunday update:
Price is back at the range lows of this 4-month range.
I'm expecting a strong bounce here, not because it's a range since all of them eventually break, but because this drop was too sharp (-25% in 4 weeks) and is extremely overextended.
🧵↓(1/5)
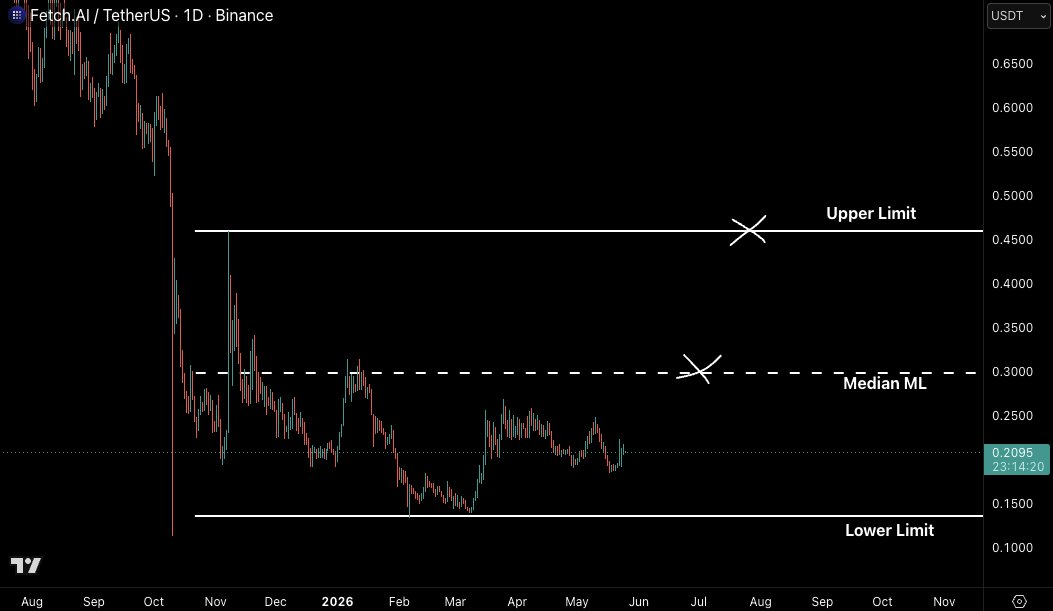
Watching for $FET and $RENDER to get going this week.
Just looking at basic ranges configured from the 10/10 Massacre bouncing out of Discounted Prices, back into Premium Prices. Similar to what $GRASS and $NEAR have done.
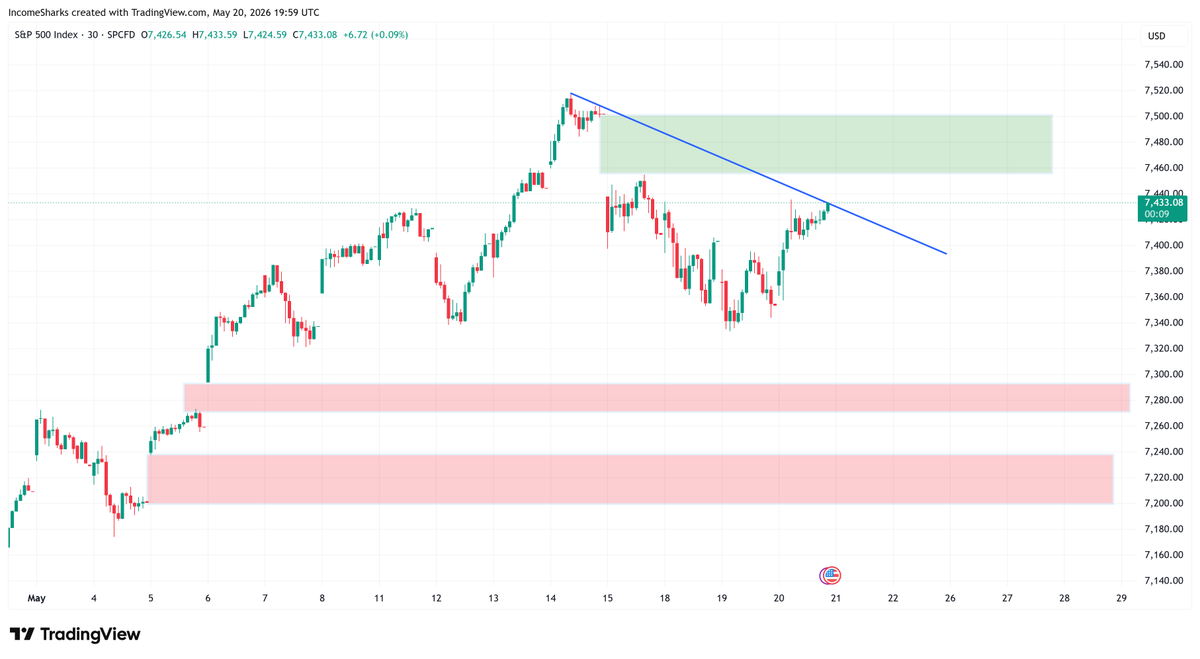
S&P 500 right at decision time. Will see how $NVDA earnings goes and if we decide to take out the upper gap or stall and hunt one of the lower ones.
$HBAR just flipped bullish. It should start its uptrend from here.🚀🚀
$HBAR Will start exploding up from here. Add more & have patience.
If you missed all the coins I shared which are pumping at the moment, do not miss $HBAR
I am buying.
This one will go the hardest.🚀🚀