🌞A cloud-free day in Java🇮🇩! 🌞
Yesterday, our #Copernicus#Sentinel2🇪🇺🛰️ satellite showed us the island practically cloud-free, and we could see some of its beautiful mountains and volcanoes
Image from 12 July:
↙️⛰️Mount Merbabu
↘️🌋Merapi Volcano
Another look at the 2019 #ozonehole with @CopernicusECMWF#AtmosphereMonitoring Service @ECMWF & #C3S data confirms how small & short lived this year's ozone hole was (due to the unusual stratospheric conditions #SSW). Here we compare the ozone hole area of all years since 1979.
1 can of deodorant = same amount of VOC emission as driving 16,500km in a 2019 Euro 6 1.2l car. Food for thought from Prof Alastair Lewis at #RSAirQuality@royalsociety @AtmosChemYork
No matter how uncomfortable and unprofitable that may be.
We must change almost everything in our current societies.
The bigger your carbon footprint – the bigger your moral duty.
The bigger your platform – the bigger your responsibility. https://t.co/obzB7gZo2Y
The first joint @eumetsat@ESA_EO@CopernicusECMWF
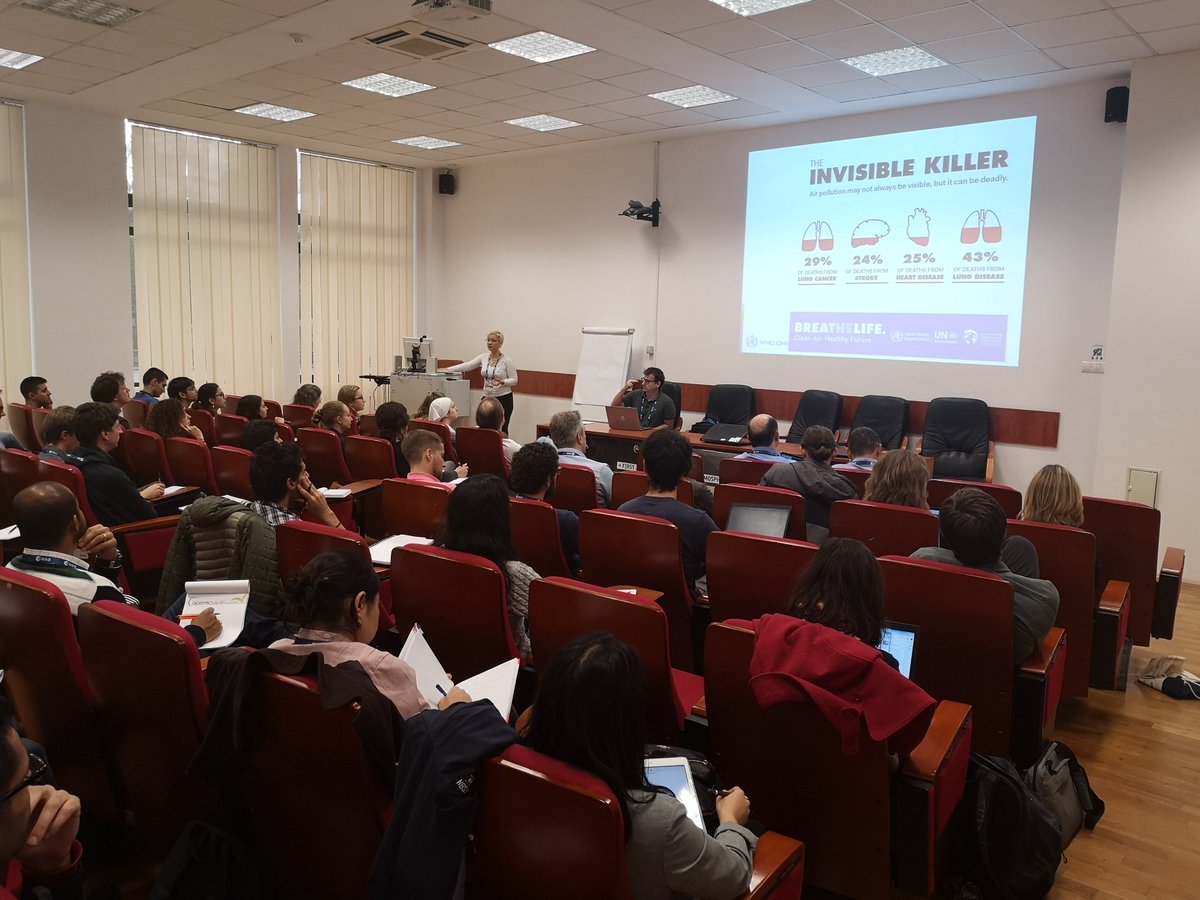
training course on atmospheric composition started at Babes-Bolyai University in Cluj, Romania this week! O.Tarasova @WMO speaks about air quality and health impact #atc2019#eo4society
We're pleased to feature @CopernicusECMWF reports and data on @CNNI:
➡ The 'Air Quality Index' map powered by Copernicus Atmosphere Monitoring Service (CAMS)
➡ A monthly 'Climate Update' report using data from the Copernicus Climate Change Service (C3S) https://t.co/XZkdsfp47d
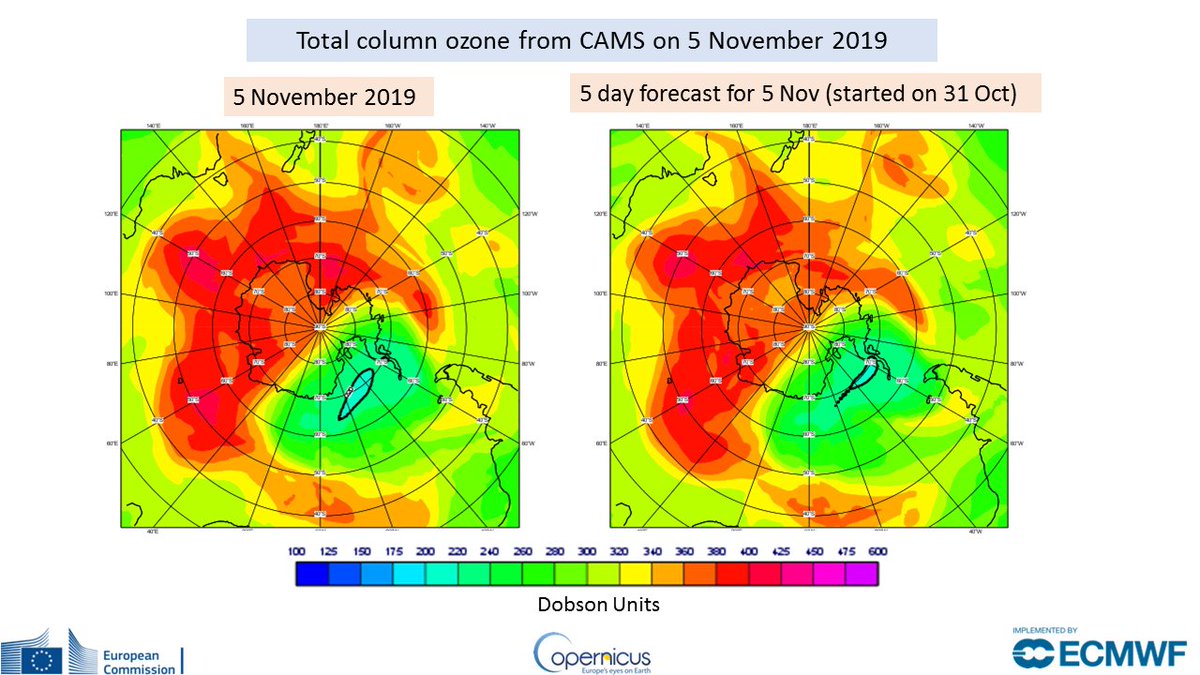
In Sep 2019 the #ozonehole was anomalously small with above average O3 values over much of Antarctica relative to a 16-yr climatology from a #reanalysis by @CopernicusECMWF#AtmosphereMonitoring Service @ECMWF; a result of a #SSW, not a sign that the ozone layer has recovered.
“The unexpected and sustained current rise in methane may so greatly overwhelm all progress from other reduction efforts that the Paris Agreement will fail,”
And seriously endanger efforts to keep the planet’s temperature in check.
#ClimateChange https://t.co/9DBsZkxqdm
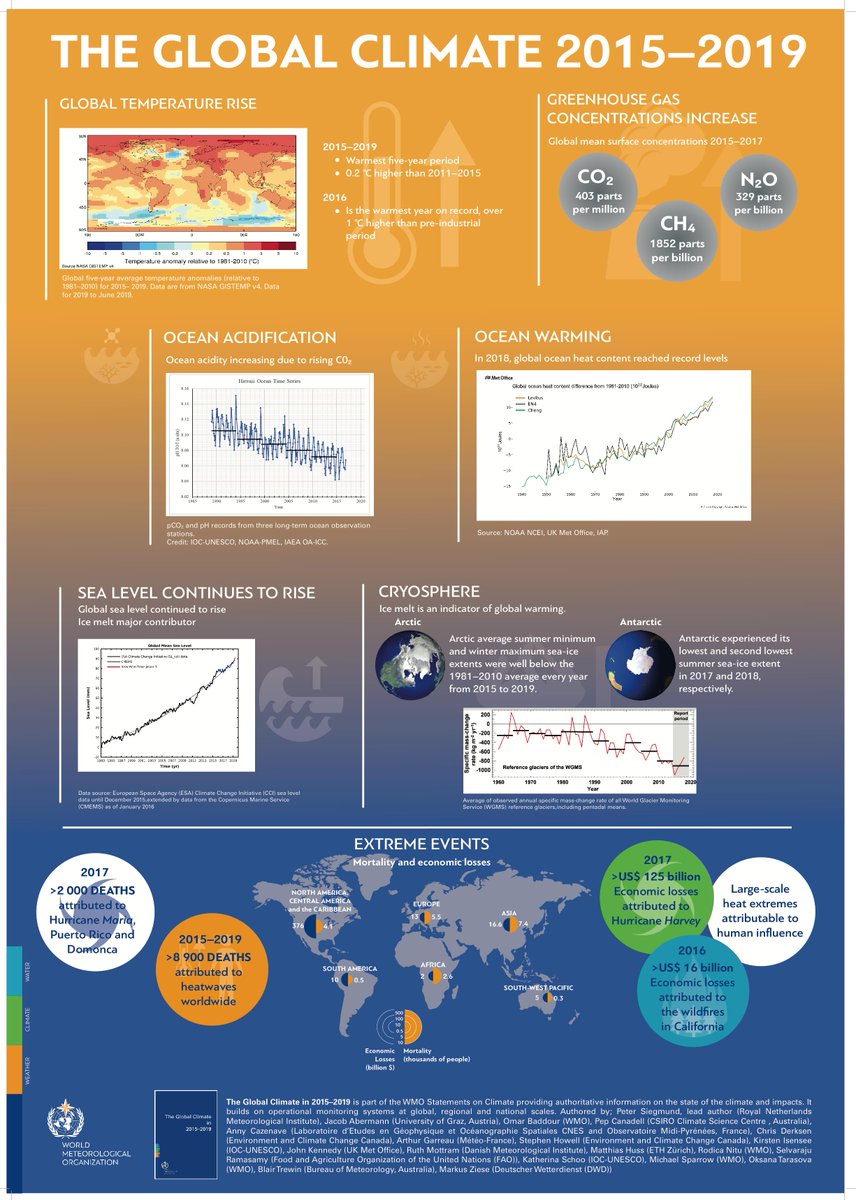
The #StateofClimate in 2015-2019, the hottest 5 year period on record
🌀extreme weather
⬆️sea level rise
⬆️ocean heat and acidity
⬆️greenhouse gases
⬇️ sea ice
⬇️glaciers
#ClimateAction#UniteBehindTheScience
The relationship between smoke and carbon monoxide emissions resulting from #wildfires is strikingly clear in the satellite data acquired today 25 September by #Sentinel3🇪🇺🛰️and #Sentinel5P over Borneo's Central Kalimantan province, in Indonesia 🇮🇩
⬇️ See GIF below
🌐This year's #OzoneHole continues to be exceptionally small, compared to 2003-2018, according to the latest data from the #CopernicusAtmosphere Monitoring Service.
This is driven by sustained warm temperatures in the stratosphere above the #Antarctic.
➡️https://t.co/c2tPB8OBuQ
Cement is responsible for 8% of the world's CO₂ emissions
If the cement industry were a country, it would be the third largest emitter in the world
It contributes more CO₂ than aviation fuel 2.5% & is not far behind the global agriculture business 12% https://t.co/M2LUp07fzS
The @CopernicusEU#Atmosphere Monitoring Service is celebrating World #OzoneDay by staying on duty tracking 2019's oddball #OzoneHole.
This animation compares it to every year since 1979, showing the variation over time.
Full update➡️ https://t.co/x8j0ldxfkw