@jturek18 Given the methodology, that’s not a reliable real time inflation metric. The latest data points will constantly be revised. I thought about replicating it, but didn’t see any value.
@NickTimiraos These median and trimmed mean metrics are heavily influenced by Rent/OER, which captured two months’ worth of variation in this release. Even so, they remain closer to the center of the distribution than to the extremes.
🇺🇸 CPI | April 2026
Underlying Inflation = Average from 5 metrics:
• CPI ex-Food at Home & Energy
• Atlanta Fed Sticky-Price
• FRBC-OER8-RENT8 Median
• Symmetric 8% Trimmed-Mean
• Symmetric 15% Trimmed-Mean
Pretty compelling argument in Garciga et al. (2026) for finer shelter disaggregation in Median CPI. Feels like a natural step for @ClevFedResearch.
https://t.co/RhgF0b9OAE
Hard to see why the BLS lacks a proper historical CPI weights database. Would be great if @ClevFedResearch shared this for Median/Trimmed-Mean. I could only go back to Dec/01 due to missing regional weights, needed for OER.
https://t.co/PSDb6vNVRx
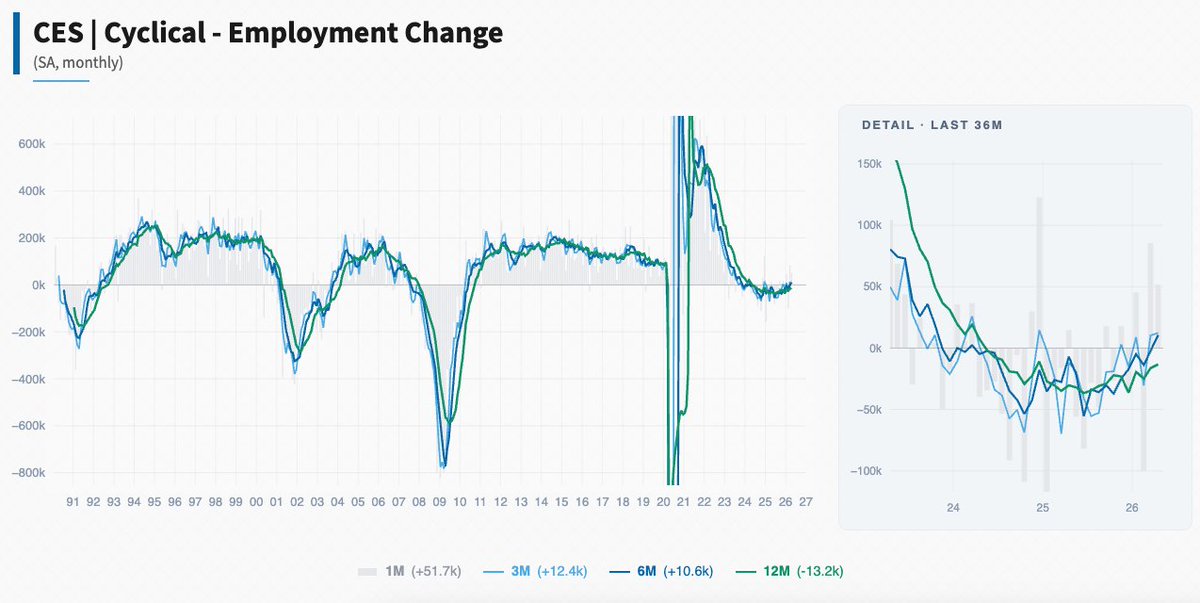
@conorsen In first differences, cyclical sectors do appear to have bottomed out around mid-last year and have gained traction in recent months.
Using @ernietedeschi’s cyclical vs. acyclical split: https://t.co/aQGgBH87nL
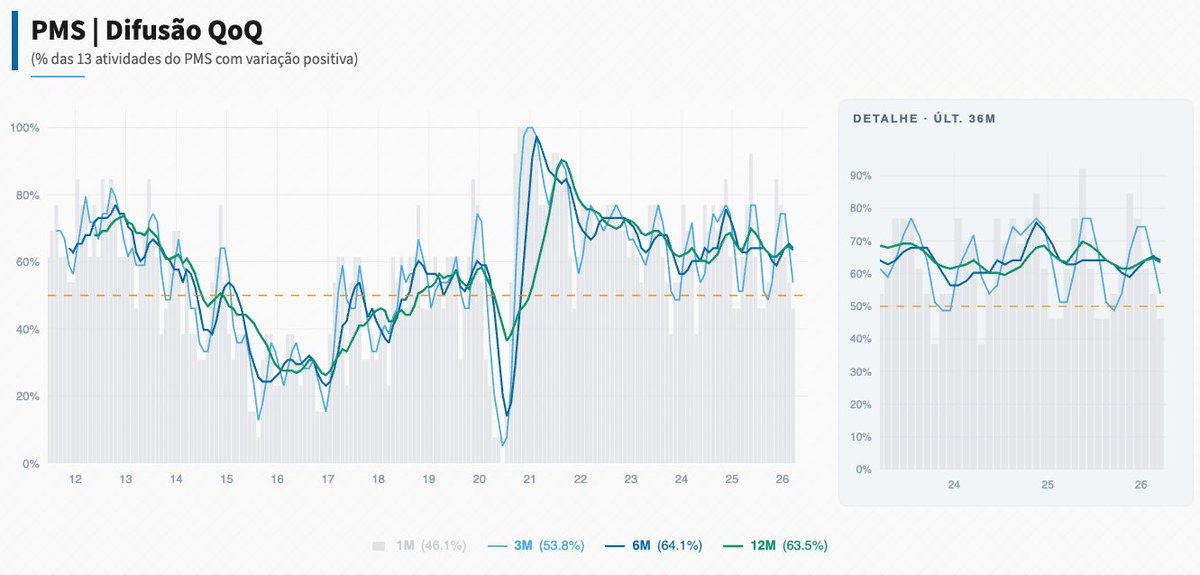
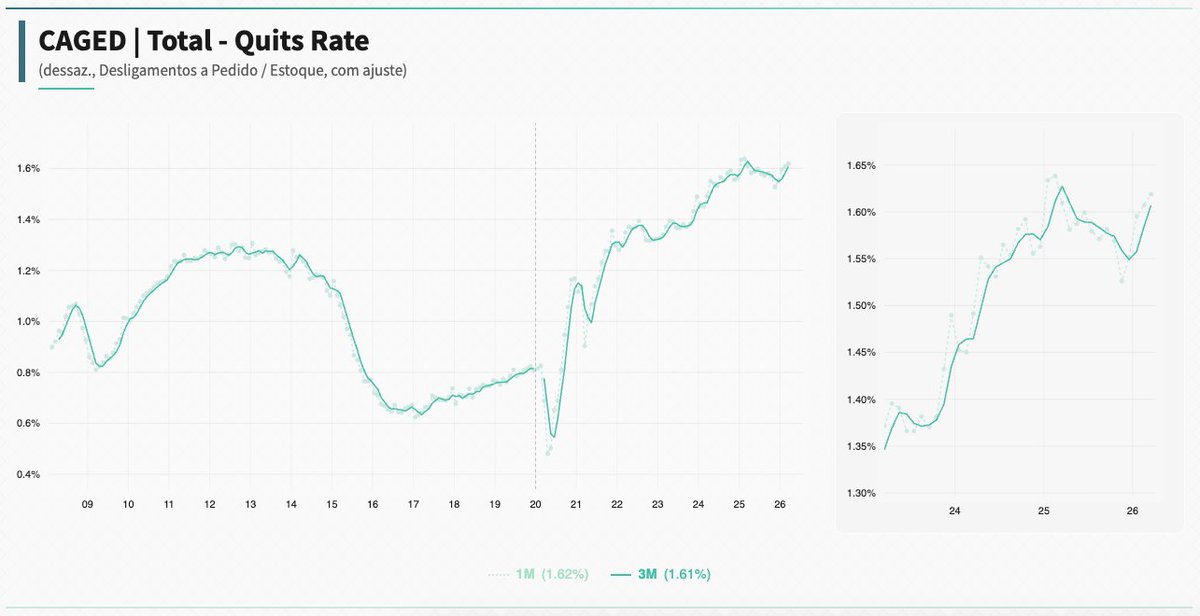
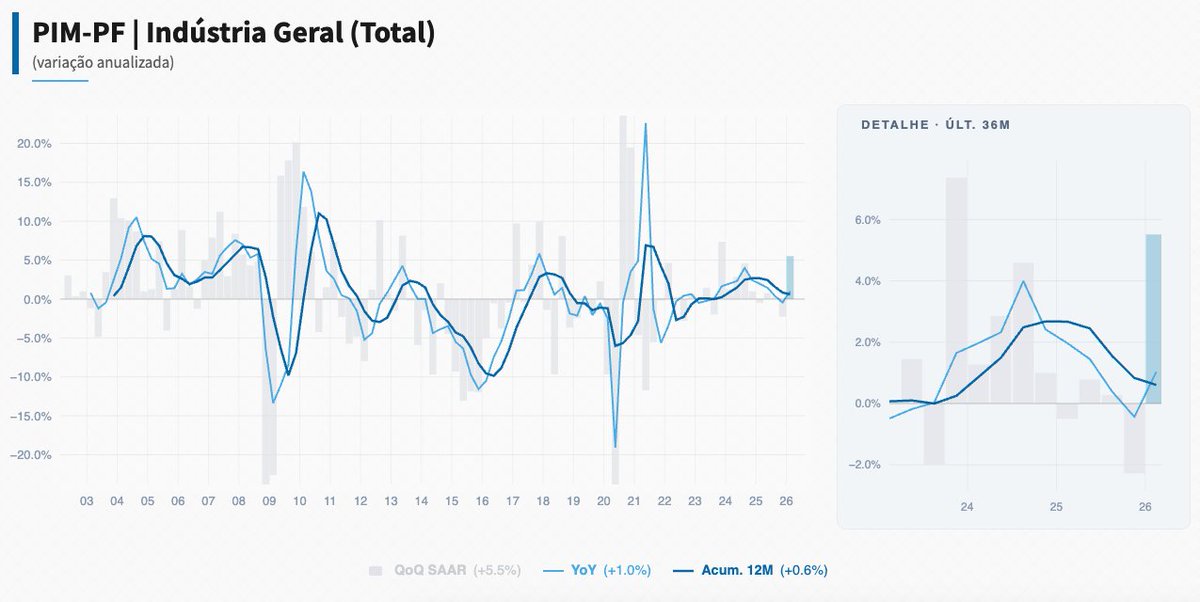
Tenho usado Claude para reconstruir algumas bases econômicas que eu costumava olhar e vou postar de vez em quando alguns gráficos para deixar guardado.