See you all tomorrow fam 🌃 🌉
One thing blockchain infrastructure teaches us is that security is not just about what you can protect. It’s also about what you can control.
Let is look at how this connects to @Starknet.
➠ 1. The challenge of shared security
Imagine living in an apartment where you control your own door lock, but the main gate belongs to everyone.
You can upgrade your lock whenever you want. But changing the main gate requires a different decision.
That is similar to one of the challenges Starknet faces.
As an Ethereum Layer 2, Starknet benefits from Ethereum’s security. However, some cryptographic components it relies on are tied to Ethereum itself.
This means Starknet cannot independently change every part of its security setup whenever it wants.
➠ 2. Why does quantum computing matter?
Quantum computing could eventually threaten some of the cryptographic systems used across blockchain networks.
The exact timeline and practical impact remain uncertain, but preparing early is better than waiting until a threat becomes urgent.
For Starknet, the challenge is not simply developing stronger cryptography.
It’s also about having the flexibility to adopt new security measures when necessary.
➠ 3. Why explore an independent Layer 1?
This is where Starknet’s exploration of an independent L1 becomes interesting.
Greater independence could give Starknet more control over its underlying infrastructure, including how it approaches future cryptographic upgrades.
But let's be clear: exploring an independent L1 does not mean the quantum threat has been solved.
As of October 22, 2026, the proposal should still be understood as an exploration, not a completed launch.
➠ 4. Does this mean Ethereum is unsafe?
Not at all.
Ethereum remains a major security foundation for Starknet.
The bigger question is how much control a network needs over its own security as technology evolves.
There is a difference between benefiting from another network's security and having complete freedom to change every underlying component.
That distinction matters when preparing for long-term threats.
➠ 5. My biggest takeaway
I believe the strongest blockchain infrastructure is built with tomorrow's challenges in mind, not just today's demands.
Quantum resistance is one part of that conversation, but so are upgrade flexibility, security assumptions, and the ability to adapt without unnecessary delays.
Starknet's exploration raises an important question for the wider Ethereum ecosystem:
How can Layer 2 networks benefit from Ethereum's security while preparing for a future where cryptographic standards may change?
That is a conversation worth having before the pressure arrives.
$MSTR
It’s important to taper expectations around $STRC for the remainder of this year.
We currently have approximately 2.5 weeks of USD cash to fund buybacks at the current pace.
There’s a lot hanging on daily dividends.
Strategy has expanded its repurchase authorization by another $1 billion, but the primary driver of $STRC buybacks so far has been the USD cash balance accumulated by the company.
That balance currently sits at $447.3 million, while our four-week average of $STRC buybacks is approximately $180 million.
At this rate, we’ll exhaust that cash in roughly 2.5 weeks.
The timing of the upcoming shareholder vote is therefore critical.
The voting deadline is October 27, with the special meeting scheduled for October 28. If approved, the proposed amendment would make November 1 the effective date for daily dividends on $STRC, with November 2 as the first payment date.
But what happens if selling pressure persists even after daily dividends are introduced?
If we assume selling pressure doesn’t disappear and buybacks need to continue, Strategy would be left with four potential options.
1. Raise more capital through the $MSTR ATM.
Issuing additional common stock and using the proceeds to repurchase $STRC would almost certainly be dilutive to gross Bitcoin per share.
However, on a net basis, after accounting for the senior claims that rank ahead of common equity, the impact could be neutral to mildly accretive.
Raising capital at a premium to the residual value that belongs to common shareholders, and then using that capital to retire $STRC’s stated amount and ongoing dividend obligations, can improve the net Bitcoin backing per remaining common share.
The exact outcome still depends on the premium at which the shares are issued and the price at which $STRC is retired.
As a benchmark, we’re currently down approximately 3.7% year to date in Bitcoin per share.
At year end 2025, we held 194,986 sats per share. Today, that figure stands at 187,753 sats.
2. Sell Bitcoin through the BTC monetization program.
Strategy could sell some of its Bitcoin holdings to raise capital for $STRC buybacks.
However, unlike raising capital through $MSTR, this approach would be dilutive to both gross and net Bitcoin per share.
The potential advantage would be tax-loss harvesting heading into the coming year.
3. Slow or pause $STRC buybacks.
This seems unlikely given recent management interviews, where the commitment to supporting the instrument and instilling confidence in the market has been emphasized.
Allowing $STRC to fall below its trading range while simultaneously pausing buybacks would massively undermine that message.
I would disagree with that approach.
4. Issue additional preferred stock.
Strategy could attempt to raise capital by issuing a new or existing preferred series.
This remains possible, but it is currently the least certain option given limited demand while STRC itself still requires active buyback support.
I want to be clear about something.
I’m fully in favor of supporting $STRC and doing what it takes to get this instrument back on track, even if that means accepting further reductions in Bitcoin per share in the short term.
But as shareholders, it’s important to understand the paths available to management and the trade-offs involved.
The ideal scenario is that daily dividends materially improve demand, allowing organic buying to increase and Strategy’s reliance on buybacks to taper off.
Today was a great day to be invested in Bitcoin and digital credit.
Fidelity is recognizing the potential scale of digital credit, while JPMorgan has outlined a base case in which Bitcoin outperforms US stocks, bonds and gold over the next decade.
The near-term path may be complicated, but the broader opportunity remains intact.
Patience is key.
Mission: Strategy.
$BTC $MSTR $STRC
I pay 100% of the rent. My girlfriend makes $75k; I make $55k. She wants to be "50/50" but only on chores, not bills. "You're the man, you should provide."
I paid $1,850 rent every month plus groceries.
Her 6-year-old son lives with us. He's not mine, but I love him. I take him to school and help with homework. Her baby daddy pays no child support but comes over three times a week to "see his son." He sits on my couch and eats my food in the apartment I fully pay for.
Last night I came home early. His shoes were at the door and his car was outside. My girlfriend said, "Oh, he just came to drop off clothes for Jayden." At 9pm with his shoes off?
I said nothing and went to the bedroom. I heard them laughing in the living room.
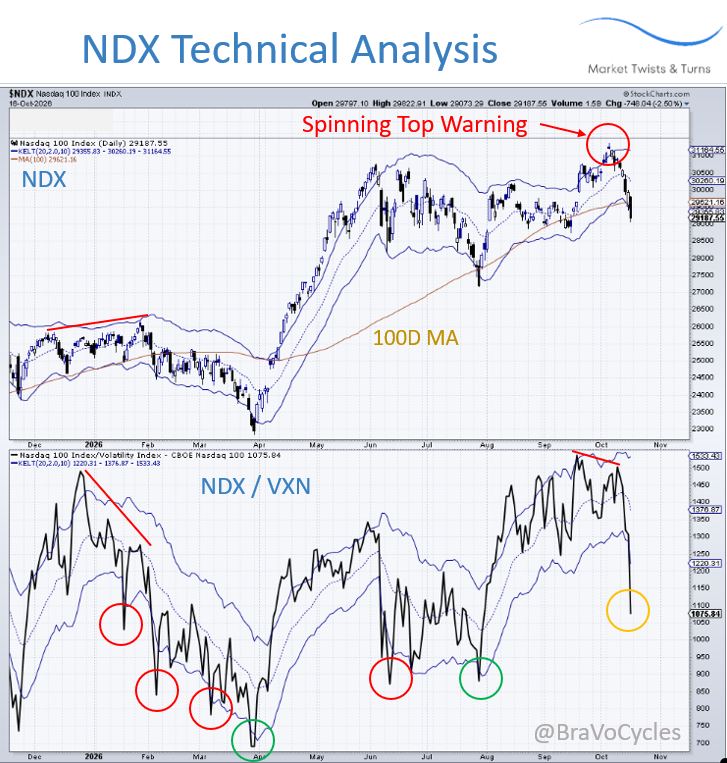
NASDAQ 100 Technical Analysis
• I warned about the Spinning Top (almost a Shooting Star candle) on the NDX chart on 5 October; it was a yellow/red flag in combination with being well above the upper Keltner channels and a weakening Bullish Percentage Index and Up-Down Percentage.
• I mentioned to expect at least revisiting the middle Keltner, and possibly lower.
• Subsequently, the NDX hit the lower Keltner channel and crossed below the 100D MA.
• Notice also that the NDX/VXN ratio (VXN is NDX VIX) exhibited a negative divergence at that spinning top, which was another bearish sign (see the lower panel); see also the early 2026 negative divergence in the NDX/VIX ratio.
• When NDX/VXN spikes above the upper Keltner channel, it usually quickly returns back inside the Keltner channel, visiting either the middle or the lower Keltner channel; A mirror image reaction happens when the NDX/VXN ratio spikes below the lower Keltner channel.
• The circles in the lower panel indicate spikes of the ratio below the lower Keltner; The first spike is usually followed by one or more additional spikes causing lower lows in NDX.
• Most often, NDX bounces within a day after these spikes, but bounces may not be significant; See red circles, which initiate bounces within downtrends, while green circles correspond to reversals and significant rebounds.
• The last spike (orange circle) suggests two things: 1) A bounce within 1-2 days, perhaps up to the middle Keltner, and 2) Likely another spike lower in the NDX/VXN ratio and possibly a lower low in price; Notice also that the Keltner is curling down.
• If the NDX does not bounce soon and keeps going down, it would be a bearish development; Other technical indicators indicate oversold conditions from which bounces start typically within 1-2 days.
• Given my explanation above, is the drop below the 100D MA a short-term bear trap?
• That would be a logical conclusion, and NDX may attempt to go back over the 100D MA toward the middle Keltner, or more.
• A failure to convincingly slice above the 100D MA would be a bearish sign.
• I also warned a couple of times in the last few weeks about extreme positioning in NDX futures, speculators long, Specialists short; see the Commitment of Traders Report Chart updated on 5 October in my post on Saturday morning.
SPX 7720 testing here and is about the Spotgamma 1 day implied move for today since open so would look for mean reversion back up into range.
Next level at 7705 would line up with SPY daily value low also near 768.65
⚡ @Algorand saw 822,434 transactions on October 10.
More than 9 transactions every second, all day long, made it its busiest day of the past 7 days.
Algorand picked a good day to show up.
📊 https://t.co/mciPEyomCD
Introducing Rain wallets.
One stablecoin balance now works across the financial system.
One wallet to get paid, earn rewards, spend at 175M merchants, and send money in 50+ currencies.
The new primary account.
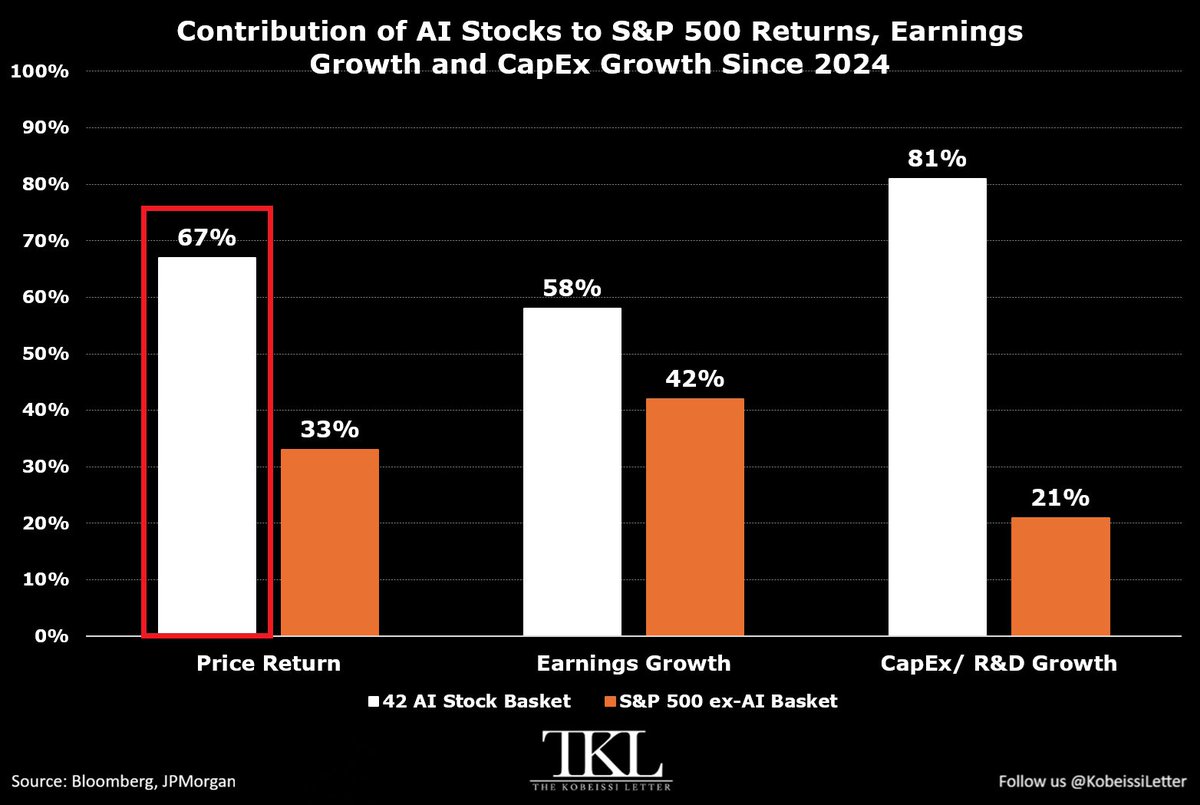
The gap between AI names and the rest of the market is historic:
Since the start of 2024, a basket of 42 AI stocks has generated 67% of the S&P 500's price return.
In other words, those names have contributed +22 percentage points to the index’s +33% gain over this period.
By comparison, the remaining 458 stocks have added +11 percentage points.
Additionally, those 42 AI stocks have accounted for 58% of the S&P 500's earnings growth and 81% of CapEx and R&D growth since the start of 2024.
The rest of the index has therefore contributed just 20% of total CapEx and R&D growth over the same period.
Meanwhile, just 29% of stocks have outperformed the S&P 500 over the last 3 years, close to the ~25% low recorded during the 2000 Dot-Com Bubble.
AI is all that matters.
$XRP is testing key support.
Bulls now need to hold this area.
If successful:
Next stop:
$1.70
Then challenge $2.00
After a breakout, watch:
$2.40 → $3+
The structure remains intact; awaiting a directional move.
#XRP#Crypto#Ripple
🚨 Global banks are under pressure as bond yields continuously rising
🇺🇸 Goldman Sachs: -22%
Bank of America: -17%
JPMorgan: -9%
🇪🇺 European bank stocks fell 3.5% on Oct. 7.
🇸🇬 Singapore banks dropped up to 9% this week.
The FDIC reported $326.7B in unrealized bond losses at US banks in Q2
With 10-year Treasury yields above 5.2%, investors fear a repeat of the 2023 Silicon Valley Bank crisis
$XRP is wrapping up its current correction.
Key support levels:
$1.38 → $1.29 → $1.21
As long as support holds, the ABC correction is likely nearing its end.
My projected price path:
$1.45 → $1.80 → $2.40 → $3.00+
Post-breakout target:
$5+
There is a lot of short-term noise, but the structure remains intact.
Watch for support confirmation and wait for the next impulse wave to kick off.
#XRP #Ripple #Crypto
working my way through the galleys of my book with a very cute baby on my chest, and my eyes drooping with sleep deprivation. all beautiful and exciting, but please say a prayer for endurance for me if you think of it!
For the last few months, every day has been filled with WAR headlines ...Hormuz closure fears, the Saudi Aramco blast, supply disruptions, and endless geopolitical uncertainty.
At the same time, experts and TV channels were projecting Crude Oil at $200–$350.
But despite all the noise, fear and bullish narratives, Crude still hasn’t broken the my key technical levels and trading in a range !
I posted about this months ago, when the war had just started.
This is the power of technical analysis.
Headlines create fear.
Experts create narratives.
Markets follow price.
Technicals don’t care about the noise. They show you what the market is actually doing.
#CrudeOil #TechnicalAnalysis #UKSYSTEM #Markets #Trading #JustSaying