So you say you are a software engineer.
Have you ever downloaded actual binaries like Kafka, Postgres, ClickHouse, Elasticsearch, Redis, or something else, and tried running them locally while exploring what those bin, lib, data, and logs, etc directories contain?
And then did you understand why they expose specific ports, what exactly gets written inside the data directory, and why in that particular format?
Did you then write your own client to call their APIs and bombard the server with requests, just to observe when CPU becomes the bottleneck, when RAM starts limiting scale, and how the system degrades under pressure?
After that, did you run the same systems inside Docker or Podman and experiment with controlling memory, security and disk limits to see how resource isolation affects behavior?
Did you go one step further and install Minikube locally, to orchestrate multiple instances of your container, simulate a multi-node cluster, and understand ingress and load balancing in practice?
And then maybe, did you spin up a free AWS EC2 instance and repeat everything on a real remote machine to understand how ssh works and how distributed systems behave outside your pc?
Or is your definition of backend engineering still limited to APIs plumbing?
Senior DevOps Engineer Interview at JioHotstar
Round 1 – Streaming at Scale, K8s, Cloud & Linux (45 mins)
1. How would you design auto-scaling for 50M+ concurrent viewers across multiple K8s clusters without over-provisioning?
2. During an IPL final, a new region needs to spin up instantly. How would you pre-warm nodes & scale workloads with zero cold-start impact?
3. Explain how you’d use Envoy + Istio to route low-latency live streams differently from VOD without service restarts.
4. What’s your approach to multi-zone pod affinity/anti-affinity to ensure a node failure doesn’t impact regional streaming SLAs?
5. How would you monitor HPA scaling decisions in real-time and detect if the metrics server is lagging?
6. Describe K8s readiness/liveness probe configs to catch buffering/lag issues in stream-processing microservices before users notice.
7. A kube-proxy update rolls out mid-match. What’s your network rollback plan to avoid packet drops?
Round 2 – RCA, Fire Drills & Streaming Chaos (75 mins)
1. Playback failures spike for only 3% of users in the APAC region. CPU, memory, and pods look fine. Could you walk through your triage plan?
2. Your Kafka ingestion pipeline lags by 2 minutes during a traffic surge. Producers are fine, consumers are idle. What’s your debug path?
3. Sudden tail latency on Redis-based stream session store during a Champions League match, how do you find & fix the bottleneck?
4. HPA refuses to scale in a critical podset even though Prometheus shows CPU > 90%. Root cause & fix?
5. NAT gateway costs double in 24 hours during a live series; no infra changes were made. What could be silently causing it?
Round 3 – Leadership, Reliability Culture & Scaling Influence (30 mins)
1. How do you build a culture where latency SLOs are enforced like uptime SLAs in a streaming org?
2. You’re asked to ship multi-region failover for live events in 2 weeks with no DNS-based routing allowed. What’s your plan?
3. How would you simulate chaos in a streaming pipeline without risking real user impact?
4. How do you justify infra costs for pre-warmed scaling capacity to executives before a major sports event?
💡 TL;DR:
If you haven’t:
Designed K8s scaling for tens of millions of concurrent sessions
Debugged Kafka lag in real-time ingestion pipelines under pressure
Simulated multi-region failover during live sports events
Root-caused tail latency in caching layers mid-stream
…then a JioHotstar interview will show you exactly where you’re not ready.
But you can train for this chaos.
#DevOps #SRE #PlatformEngineering #Kubernetes #StreamingScale #Observability #ChaosEngineering #InfraThrone #HotstarScale #RCADrills
I have two EC2 instances.
EC2-A → client
EC2-B (10.0.2.15)→ server running an app on port 8080
From EC2-A:
curl http://10.0.2.15:8080 → works ✅
ping 10.0.2.15 → fails ❌
Security group is open for TCP 8080.
Why does ping fail while curl works?
What happens when we run :
kubectl apply -f deployment.yaml
Flow:
- kubectl sends request to API Server
- API Server stores configuration in etcd
- Controller Manager sees desired state
- Scheduler selects worker node
- Kubelet pulls container image
- Container runtime starts container
Pod becomes running 🎉
@SumitM_X Since this involves finances, the 2 Phase Commit along with idempotency is the solution I can think of
Another possible solution can be based event bus architecture, but that usually guarantees eventual consistency which is risky in this case
So, 2 PC + idempotency it will be
Your database is sharded by user_id.
A transfer API needs to move money from User A to User B, but they are on different shards.
How would you design this transfer so that money is not lost or duplicated ?
Backend Interview question that is being asked a lot these days :
You are implementing an API that returns users to the client, but the database has 1 M(1000000) users
How will you return data to the client efficiently?
Let me talk about something obvious but with a bit of quantification...
Theoretically, both arrays and linked lists take O(n) time to traverse, but here's what actually happens when you benchmark by summing 100k integers
- Array: 68,312 ns
- Linked List: 181,567 ns
Summing an array is ~3x faster than LinkedList. Same algorithm, same complexity, but wildly different performance.
The reason is cache behavior. When you access array[0], the CPU fetches an entire cache line (64 bytes), which includes array[0] through array[15]. The next 15 accesses are essentially free. Arrays hit the cache about 94% of the time.
Linked lists suffer from pointer chasing. Each node is allocated separately by malloc(), scattered randomly in memory. Each access likely requires a new cache line fetch, resulting in a 70% cache miss rate.
This is a good example of why Big O notation tells only part of the story. Spatial locality and cache-friendliness can make a 2-3x difference even when the theoretical complexity is identical.
I am sure you would have known this, but this crude benchmark quantifies just how fast cache-friendly algorithms can be.
Hope this helps.
The Anatomy of a WebSockets frame
With a maximum header size of 14 bytes makes more efficient for bidirectional use cases (eg chatting, gaming) compared to using long polling which has the overhead of HTTP headers.
Maximum message size can be up to 2^63 bytes
Of course being on top of TCP we suffer the head of line blocking.
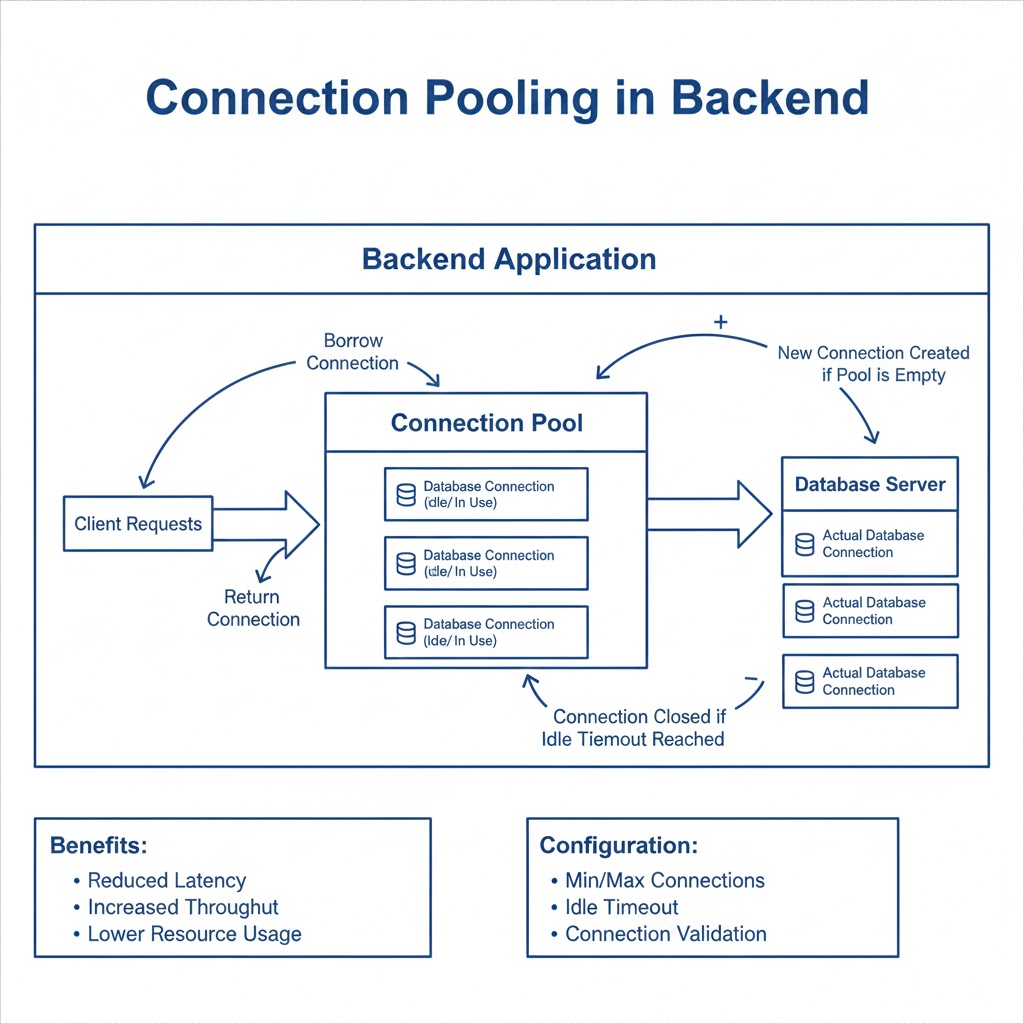
Connection Pooling in Backend
→ Connection pooling is a backend optimization technique that reuses a set of active database connections instead of opening a new one for every request.
→ Without pooling, each request must create, authenticate, and close a database connection,an expensive and slow operation under load.
✓ 1. Why Connection Pooling Matters
→ Databases can handle only a limited number of simultaneous connections.
→ Creating new connections for every request increases latency.
→ Pooling reduces overhead, improves performance, and prevents connection exhaustion.
✓ 2. How Connection Pooling Works
→ A pool maintains a fixed number of database connections.
→ When a request arrives, it borrows a connection from the pool.
→ After the query finishes, the connection is returned to the pool.
→ If the pool is full, new requests wait until a connection is available.
✓ 3. Key Benefits of Connection Pooling
→ Faster database access due to reused connections
→ Lower CPU and memory usage
→ Improved scalability under high traffic
→ Stable system performance with predictable connection limits
✓ 4. Configuring Pool Size Properly
→ Too few connections cause delays because requests must wait.
→ Too many connections overwhelm the database.
→ Ideal pool size depends on:
→ Number of CPU cores
→ Database capacity
→ Query complexity
→ Traffic volume
✓ 5. Common Backend Tools for Pooling
→ Node.js: pg-pool, Prisma, Sequelize
→ Java: HikariCP, Apache DBCP
→ Python: SQLAlchemy pool, Django ORM pool configs
→ Go: Built-in database/sql pooling
✓ 6. Avoiding Pool Misconfigurations
→ Do not create a new pool on every request,create once and reuse it.
→ Prevent idle connections from staying open too long.
→ Set timeouts for acquiring and releasing connections.
✓ 7. Monitoring Pool Health
→ Track active, idle, and waiting connections.
→ Watch for timeouts or long-lived queries.
→ Adjust pool size based on real traffic data.
→ Grab the Backend Development with Projects Ebook to learn connection pooling with real backend scenarios, database optimization techniques, and hands-on project implementations.
🔗 https://t.co/QdeNEmpNfI
Netflix Engineering: DB Migration to Aurora results in 75% speedup
Blog: https://t.co/BXPsY3asvU
Paper: https://t.co/IynKHLdX2W
System Design Course: https://t.co/Z2zxvshP01
#Netflix#Aurora#DatabaseMigration
If you need to cache a query result in Postgres, consider using a materialized view before introducing another caching solution. Let’s take a simple example.
Imagine we define a regular view that returns all orders for the last day (24 hours):
CREATE VIEW sales_summary AS
SELECT id, product_id, purchased_at
FROM orders
WHERE purchased_at >= now() - INTERVAL '1 day';
A view in Postgres is just a named query that you can call like this:
SELECT count(*) FROM sales_summary;
Every time you call the view, Postgres runs the underlying query and returns the latest data.
But what if you want the view to cache its result and refresh it only once an hour? Easy. Add the MATERIALIZED keyword when creating it:
CREATE MATERIALIZED VIEW sales_summary AS
SELECT ...
During the first invocation, the materialized view stores (caches) its result, which is returned on subsequent calls. Even if new orders are added to the table, the view will ignore them until you refresh it explicitly:
REFRESH MATERIALIZED VIEW sales_summary;
It’s up to you how and when to refresh the view. You can do this hourly or more/less frequently. You can call the REFRESH statement from your app logic or use the pg_cron extension. Postgres gives you plenty of options.
Learn more in Chapter 2 of the Just Use Postgres book: https://t.co/41DnIUz4EZ
In college, I always struggled with ACID properties in DBMS.
I knew the full form.
Atomicity, Consistency, Isolation, Durability.
But honestly, none of it made sense to me back then.
I only understood it properly years later, while working on real systems at Cisco.
Let me explain it the way I finally understood it.
Imagine you have a savings account with 25,000 in it.
Your bank needs you to maintain a minimum balance of 5,000.
And you are transferring some amount to a friend.
A transfer has two steps.
Money goes out of your account.
Money goes into your friend’s account.
If the first happens and the second fails,
you end up losing money
and your friend still doesn’t receive anything.
That is an inconsistent and unfair state for the system.
Atomicity simply means
both steps must succeed together
or none of them should happen.
Consistency means
your transfer should not break the rules of the system.
If you try to send your full 25,000
your balance becomes zero
which violates the minimum 5,000 requirement.
So the system should not allow it.
Isolation is about timing.
Your account gets debited at one moment.
Your friend gets credited a little later.
If someone checks the balances in between,
they should not see half-done data.
They should either see the situation before the transfer
or after the transfer,
but never the messy middle.
Durability is the simple idea
that once the money has been transferred and committed,
it should never be lost
even if there is a crash or power failure.
That’s ACID.
The real version.
The version that finally clicked for me.
If you want me to simplify more concepts like this,
tell me which one I should take up next.
P.S. My new Data Engineering batch starts this Saturday. DM to know more!
#bigdata #sql #dataengineering
1. When you have high reads and writes (balanced workloads):
- Use a primary database for all writes.
- Offload heavy read traffic to multiple read replicas via async replication.
- Use Redis cache to handle hot keys and reduce database load.
- Expect occasional cache misses to fall back to the primary.
- Batch writes and optimize indexes to keep performance stable.
2. When your write load keeps growing:
- Shard the database.
- Each shard stores a slice of the dataset, so writes get distributed.
- Your app must know how to route requests to the right shard.
- Great for massive scale, tricky for complex queries or cross-shard transactions.
3. When you need hybrid scalability (NewSQL):
- Systems like CockroachDB act like SQL but scale like NoSQL.
- Auto-sharding and auto-rebalancing come built-in, so you don’t manage shards manually.
- Provides global consistency across nodes.
- Useful for multi-region apps needing strong consistency and fault tolerance.
4. When you need high-integrity financial operations (@TigerBeetleDB):
- It is designed specifically for accounting, payments, and ledger systems.
- Blazing fast, crash-consistent, and built with a formal verification mindset.
- Ensures correctness first — prevents double-spends, race conditions, and partial writes.
- Really Ideal when money is involved and every transaction must be exact, durable, and safe.
My 2 cents:
Pick your database strategy based on read/write patterns, latency requirements, and how fast your dataset is growing. There is no universally best choice - only the best choice for your workload.
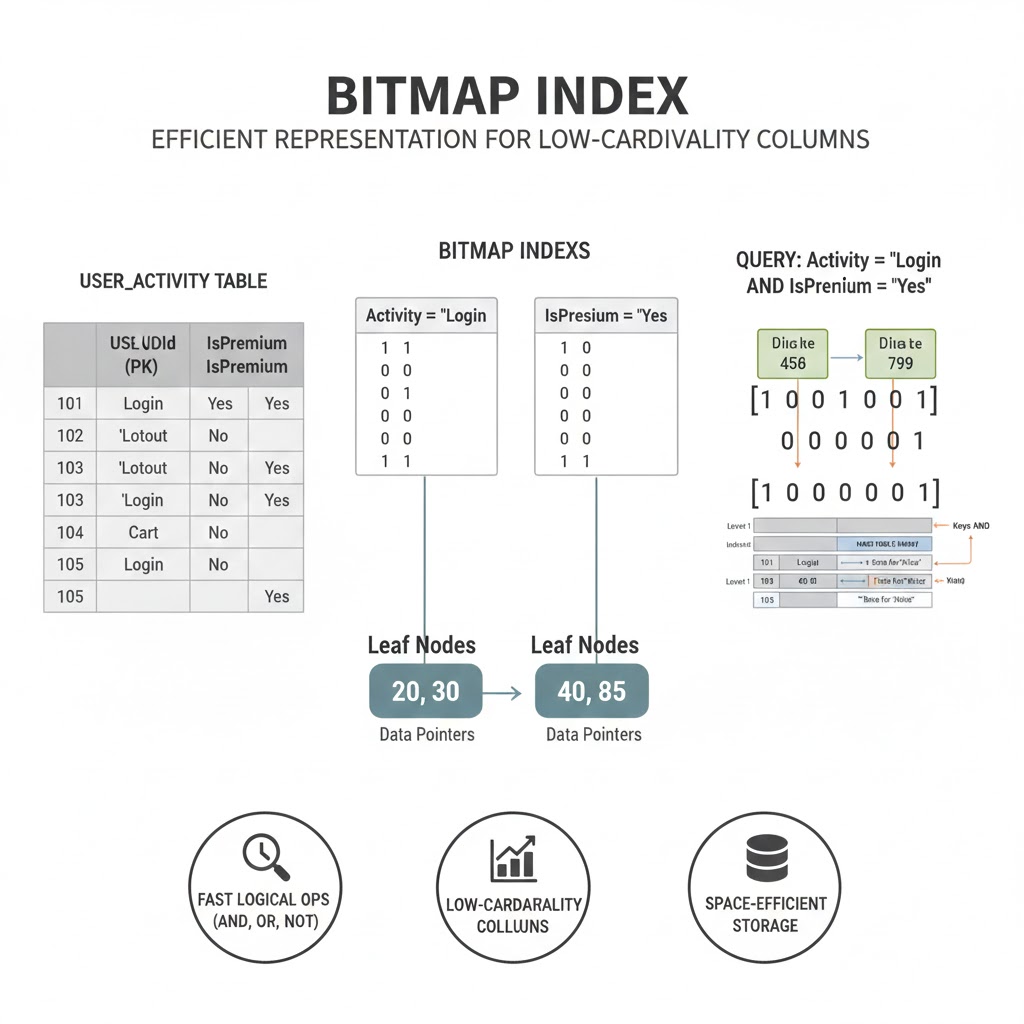
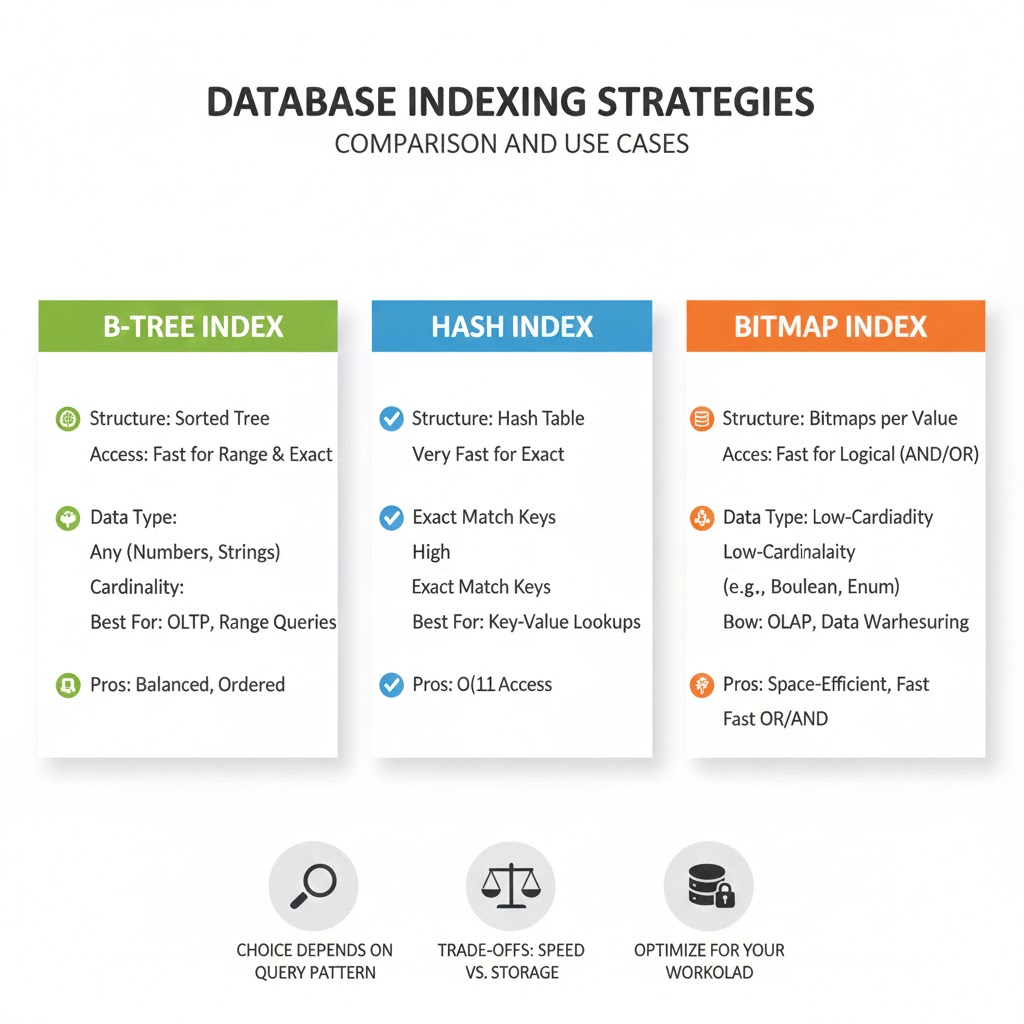
Database Indexing Strategies in Backend
→ Indexing is one of the most powerful ways to speed up database queries in backend systems.
→ Good indexing reduces lookup time, improves joins, and enhances overall performance—without changing application logic.
✓ 1. Primary Indexes
→ Automatically created on primary keys.
→ Ensures fast lookups for unique identifiers.
→ Always index your primary key fields for efficient record retrieval.
✓ 2. Secondary Indexes
→ Created on non-primary columns frequently used in searches.
→ Ideal for fields like email, username, or status.
→ Helps filter queries quickly without scanning the whole table.
✓ 3. Composite Indexes
→ Indexes that involve multiple columns.
→ Best when queries filter or sort by multiple fields.
→ Order matters: an index on (country, city) helps a query filtering by both but not by city alone.
✓ 4. Unique Indexes
→ Ensures no duplicate values exist.
→ Useful for emails, usernames, or any field requiring uniqueness.
→ Also improves performance because the database optimizes for unique checks.
✓ 5. Full-Text Indexes
→ Optimized for searching phrases and keywords.
→ Useful for blogs, product search, messaging apps.
→ Supports natural language queries like “find posts about backend design.”
✓ 6. Partial / Filtered Indexes
→ Index only part of a table (e.g., active users).
→ Reduces index size and boosts speed when data has predictable patterns.
✓ 7. Covering Indexes
→ Contains all required columns for a query.
→ Allows the database to answer the query using only the index—no table scan.
→ Ideal for SELECT-heavy workloads.
✓ 8. Indexing for Joins
→ Always index foreign keys.
→ Ensure both sides of join conditions are indexed.
→ Improves multi-table queries significantly.
✓ 9. Avoid Over-Indexing
→ Each index increases storage size.
→ Slows down write operations (insert/update/delete).
→ Only create indexes for real, repeated query patterns.
✓ 10. Monitoring Index Performance
→ Use EXPLAIN or ANALYZE to check index usage.
→ Remove unused indexes to reduce overhead.
→ Continuously adjust indexing as your data and queries evolve.
→ Grab the Backend Development with Projects Ebook: https://t.co/QdeNEmpNfI