$NIO trades like a company that's still bleeding cash. It isn't anymore!
Q2: revenue up 69% YoY, gross margin nearly doubled to 18.4%, third straight quarter of adjusted operating profit. Net loss down 89% YoY.
$8.36B in cash and liquidity. Market cap sits around $9B.
The balance sheet alone is nearly the entire valuation. The market cap barely moved. The business did.
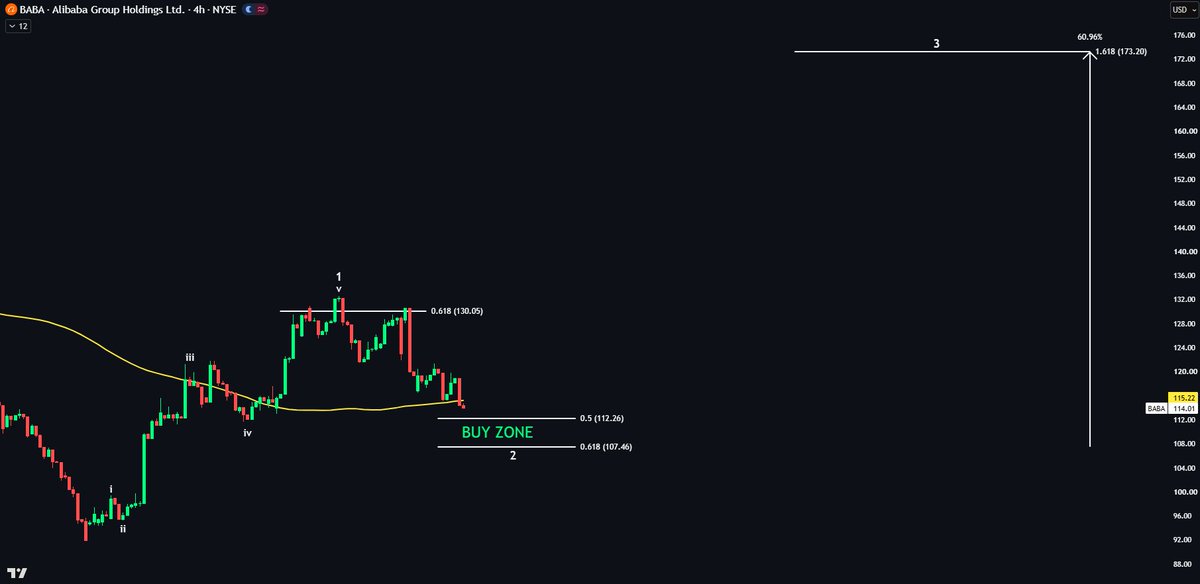
$BABA $KWEB $FXI the signal was there and you saw it 3 weeks ago on this chart: this is a positional BUY not a short-term trade....Don't wait and increase the % of Chinese stocks in your portfolio....the wind has changed... I'll wait for you on my blog https://t.co/8pNBSzmCJ8
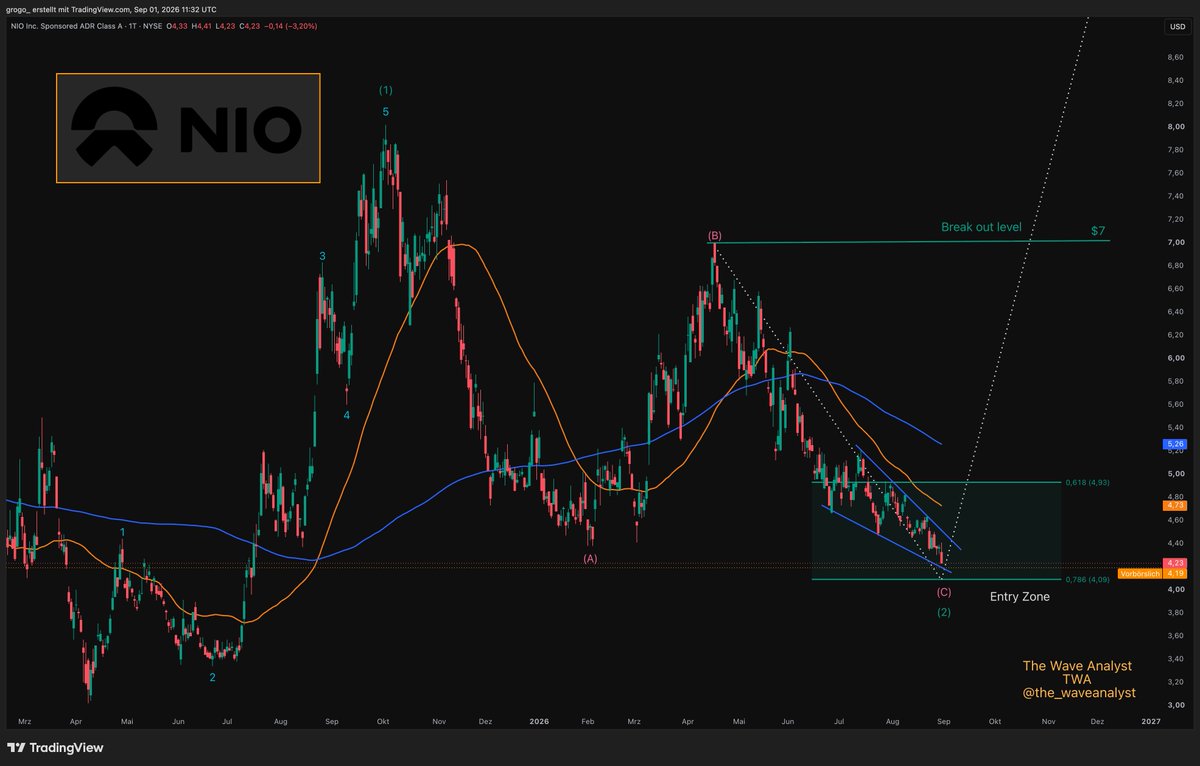
$NIO — Wave (C) of 2 completing right in the entry zone.
Entry zone: $4.09 → $4.93.
Breakout level: $7.00.
$8.36B in liquidity against a market cap that's barely above it. The stock is quietly fixing its financials while price sits at multi-month lows. That gap doesn't last.
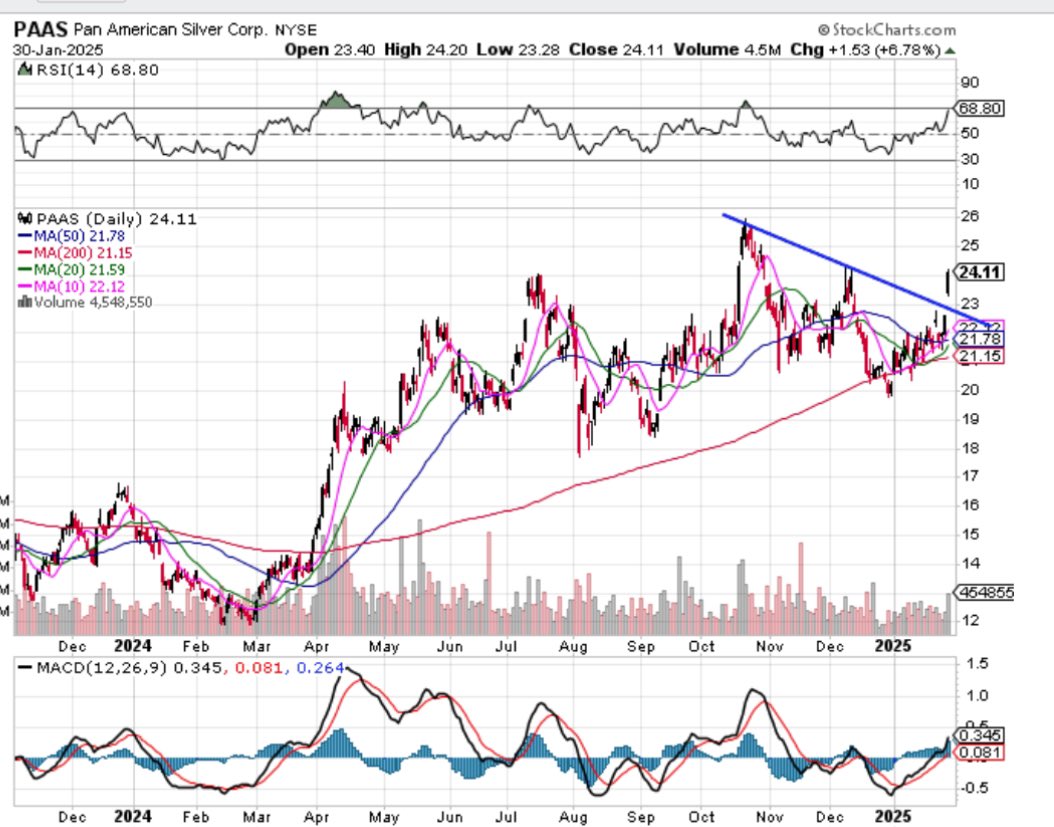
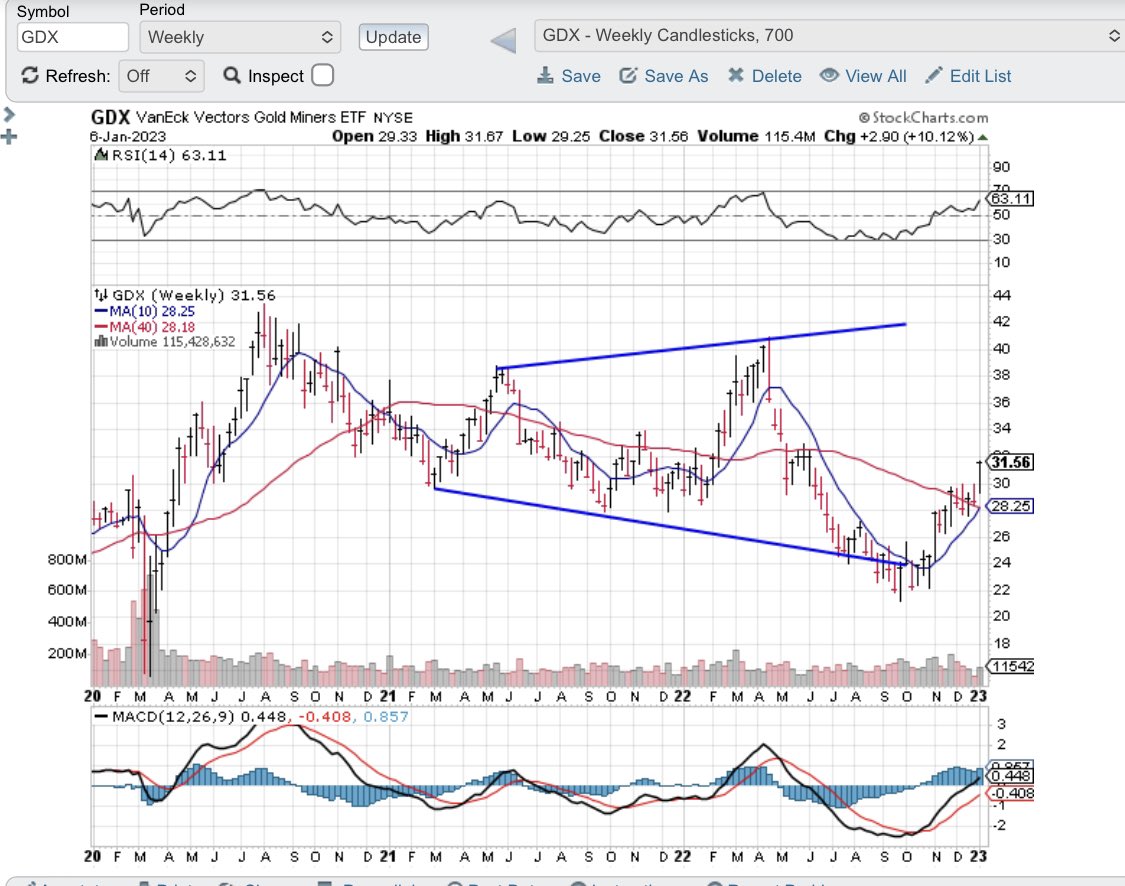
This looked like an exhaustion gap off a 3rd stage base. With some low vol weekly bars on attempted breakout. Short to medium term top 2-3 years into uptrend?
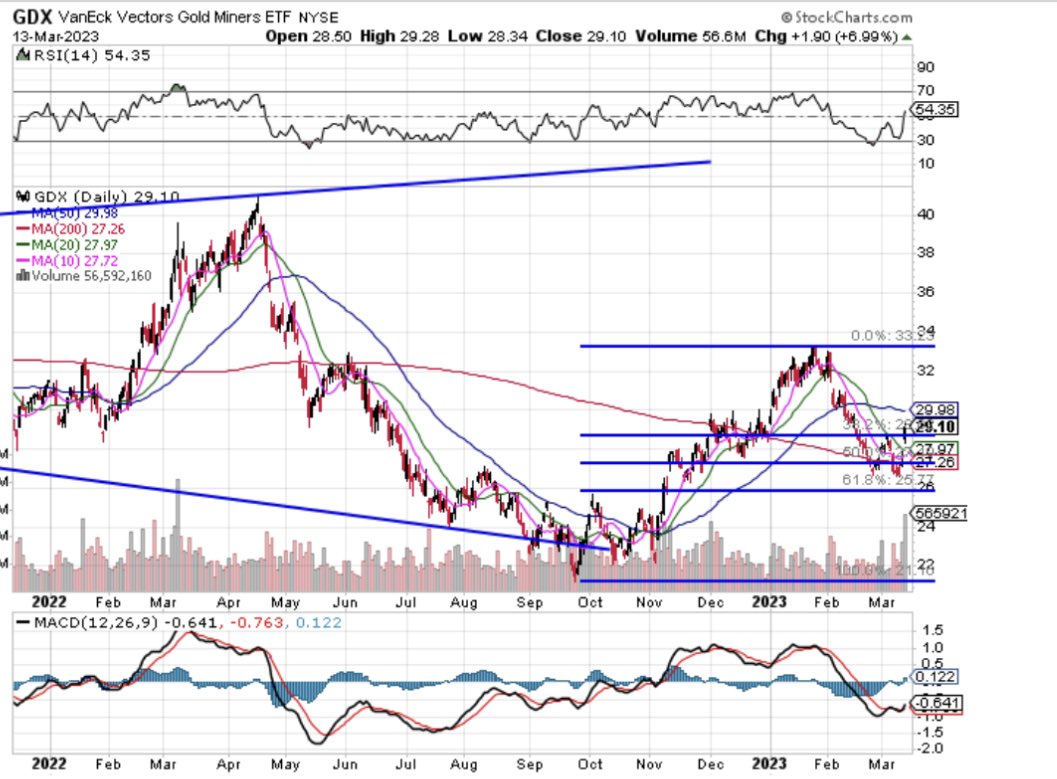
$GDX may have just printed a DCH in a right translated daily cycle 5 but I will wait until after the backtest before labelling. Once the DCH is set I expect $GDX to decline into a DCL. A break of the 10 day MA and lower daily inclining trend line will signal an impending DCL
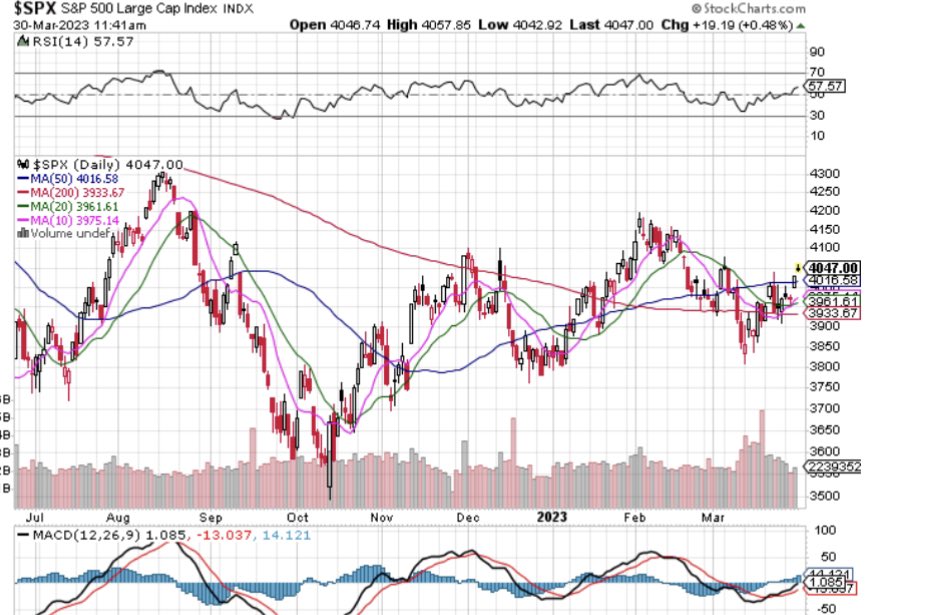
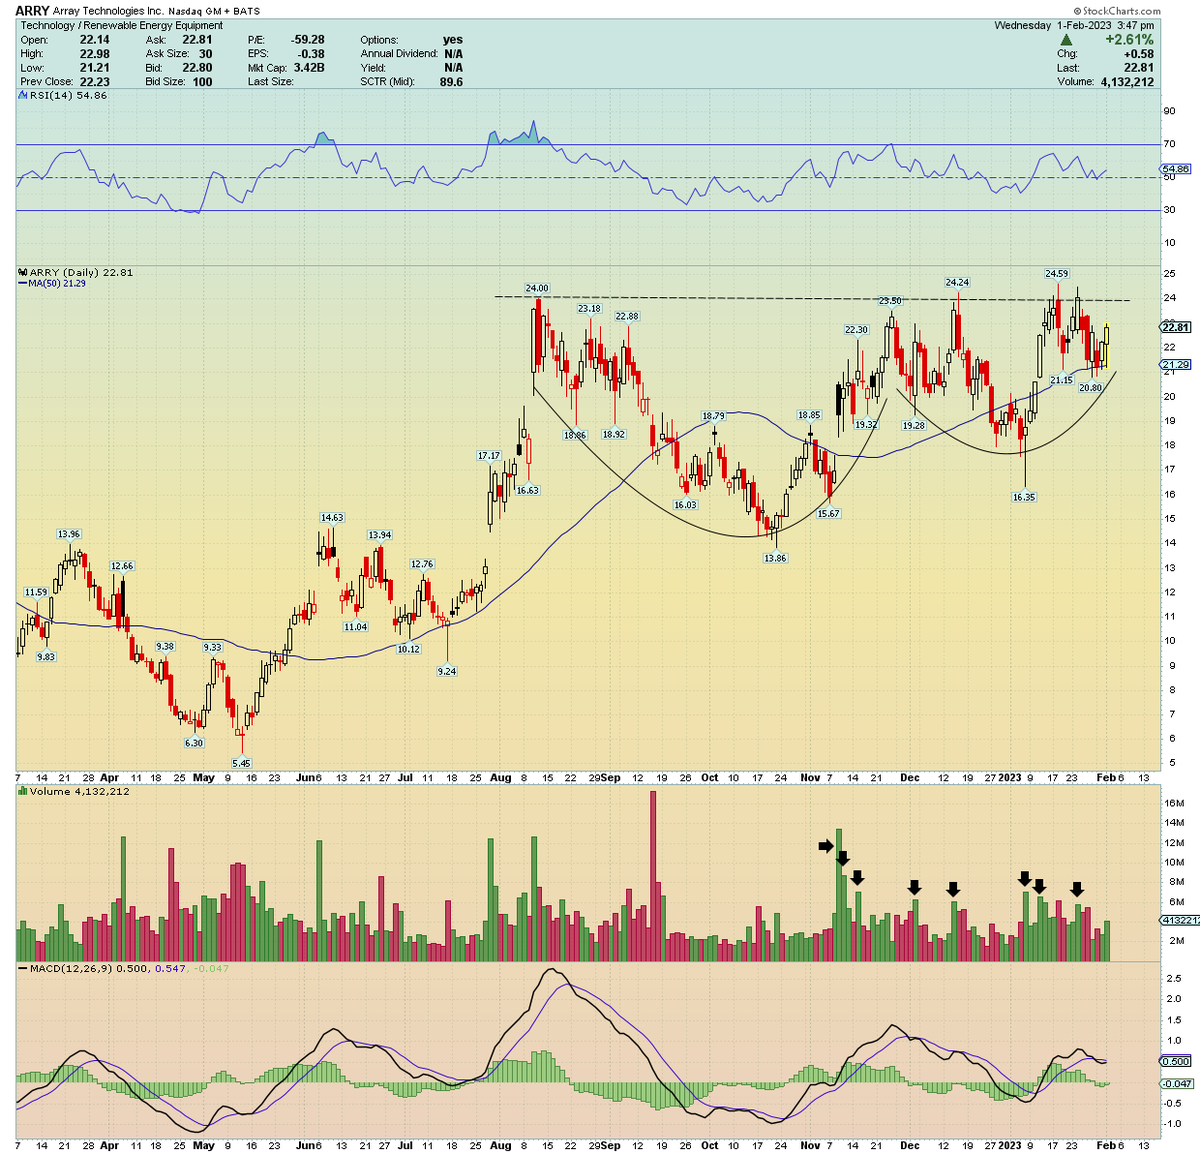
Market had a secondary follow through day yday. The follow through day in Oct has still stuck. I try and find groups that are breaking out around these FTDs. Aside from solar name $CSIQ, the RS and breakout of $GDX complex from low handle stuck out to me this week. $GDX $SIL