➡️ Decisões do @STF_oficial reforçam a transparência na destinação de emendas parlamentares. Os posicionamentos da Corte também visam garantir o cumprimento dos princípios constitucionais da rastreabilidade e publicidade na gestão de recursos públicos: https://t.co/2T1ykbtp1Q
#PraTodosVerem: contém descrição da imagem
Oldies but goldies: David Broomhead, David Lowe, Multivariable Functional Interpolation and Adaptive Networks, 1988. Introduces RBF neural networks. https://t.co/rt3ar2gRpJ
{spanishoddata} is a new and in-progress #rstats package for importing large origin-destination (OD) datasets released by the Spanish Ministry of Transport by Egor Kotov, me + growing #opensource community. Thanks Eugeni Vidal-Tortosa for improved docs 🙏 https://t.co/R5VY7ltpzo
Random number generation from different distributions is a fundamental concept in statistics and data analysis. It's crucial for simulations, probabilistic modeling, and various machine learning applications.
✔️ When done correctly, it allows for accurate modeling of real-world processes, enhances the quality of simulations, and ensures robust statistical analyses.
✔️ It provides flexibility in data analysis by allowing the use of various distributions to model different types of data.
✔️ Proper generation and usage of random numbers can significantly improve the performance of machine learning algorithms by providing diverse and representative training data.
❌ However, if not handled properly, the generated random numbers might not represent the intended distribution, leading to biased results and incorrect conclusions.
❌ Misunderstanding the properties of different distributions can cause errors in statistical analysis and simulations, which might affect the outcomes of research or data-driven decisions.
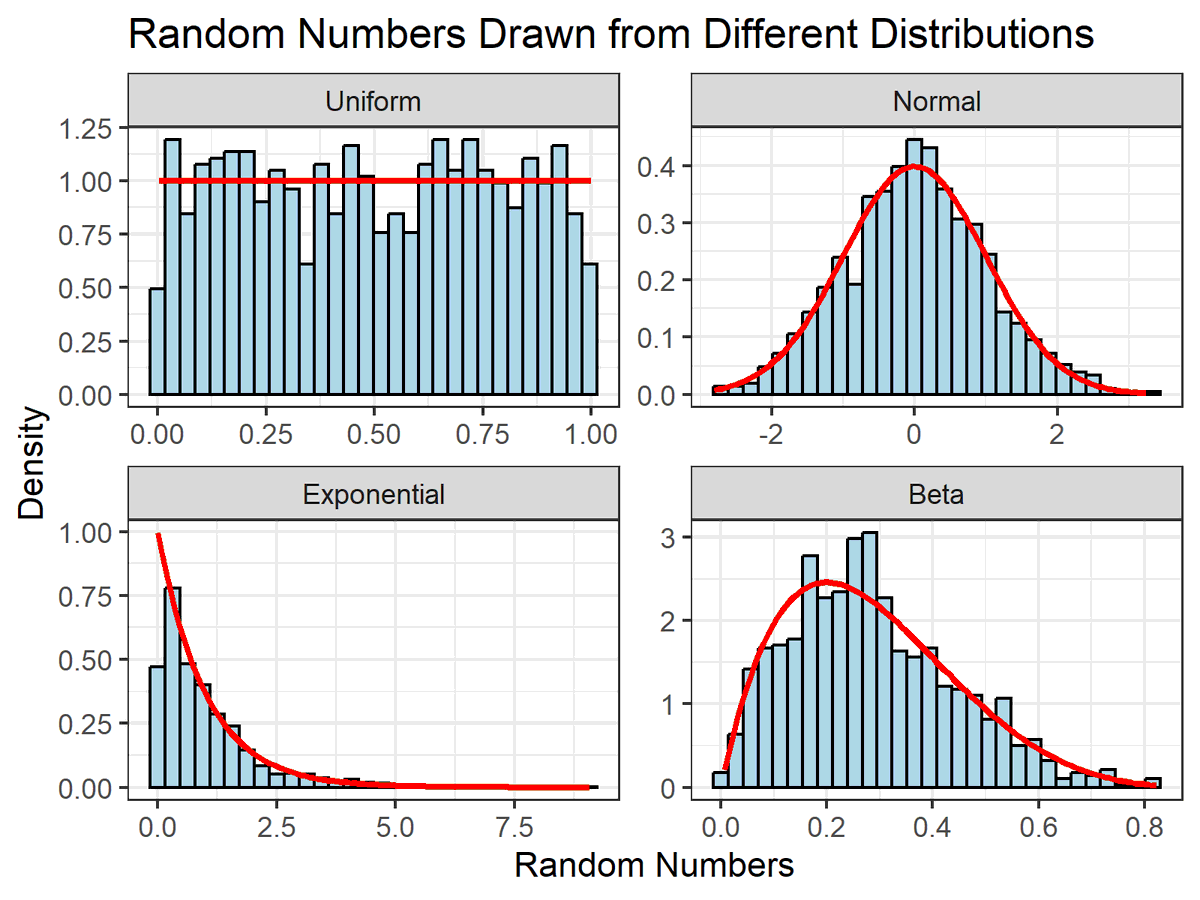
To handle random number generation effectively, it's important to understand the properties of different distributions. The visualization of this post demonstrates how random numbers from Normal, Uniform, Exponential, and Beta distributions differ in shape and density. Each panel shows the histogram of random numbers and the theoretical density curve in red, helping to visualize how well the generated data matches the expected distribution.
🔹 R: Use the ggplot2 library for visualizing data from different distributions and functions like rnorm(), runif(), rexp(), and rbeta() for generating random numbers.
🔹 Python: Use libraries such as numpy for generating random numbers with functions like np.random.normal(), np.random.uniform(), np.random.exponential(), and scipy.stats for more advanced distribution functions and data visualization with matplotlib.
Check out my online course on Statistical Methods in R, starting on September 9, 2024, for a deeper dive into random number generation and other related topics!
For more information, visit this link: https://t.co/7YQCRDKSPO
#ggplot2 #tidyverse #DataVisualization #datasciencetraining #datastructure #rstats
🎨📊 ¿Qué funciona (y qué no) cuando se trata de usar colores en tu #dataviz?
El color es una herramienta fundamental. Una mala elección puede hacer que una visualización sea confusa o difícil de interpretar.
👇 5 consejos clave
https://t.co/CZEei4oM0X
#stats#rstats#python
Bayes' theorem is used to update the probability for a hypothesis as more evidence or information becomes available. Bayes' approach to probability was notably different from the frequentist approach, which dominated statistical methods at the time.
Escândalo do MEC: MP pede retomada de investigação que atinge Bolsonaro e ex-ministro Milton Ribeiro. Investigação sobre suposto esquema de propina envolvendo pastores travou após suspeita de interferência de Bolsonaro nas investigações (G1)