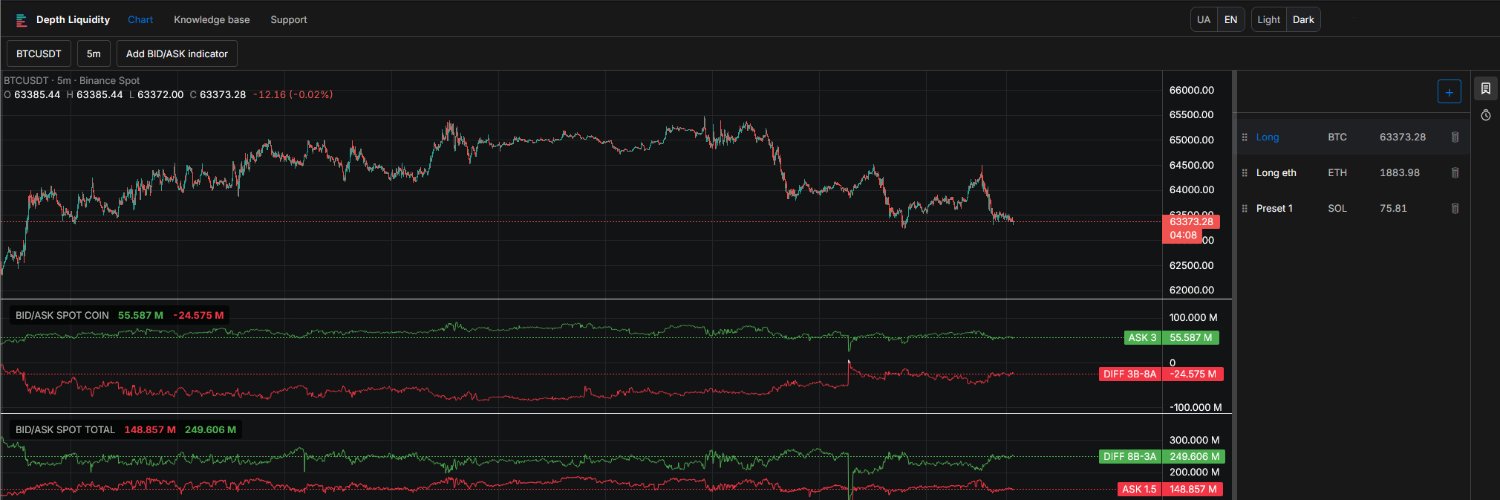
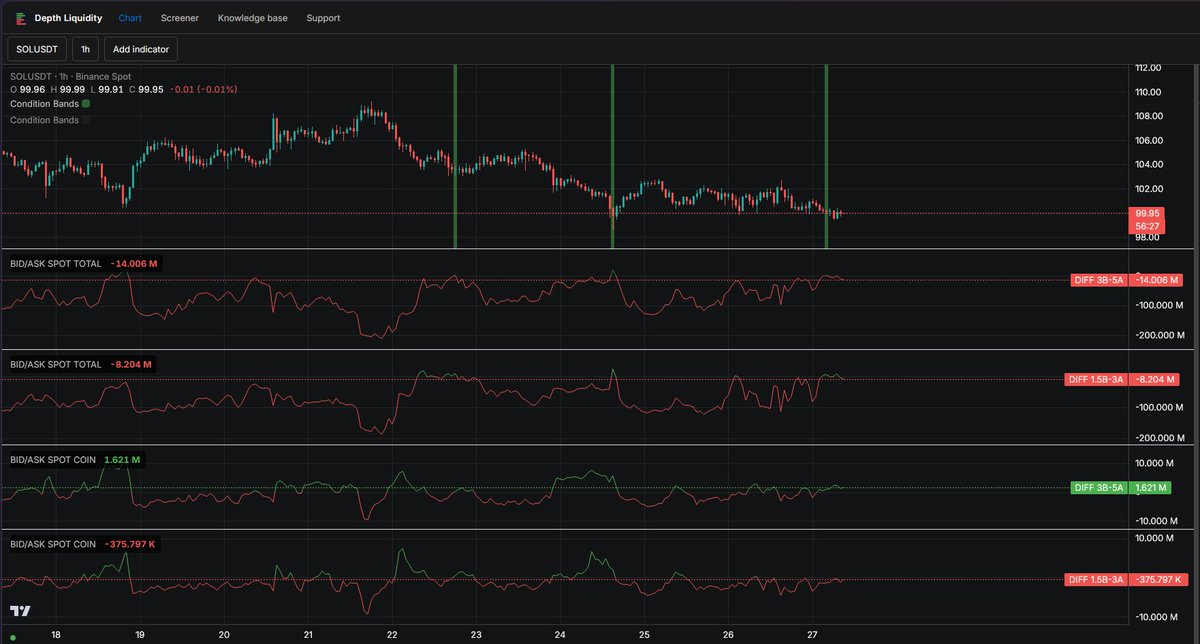
Depth Liquidity shows how much money is actually sitting in the order book near the price. #crypto
Candles tell you where price has been. The book shows who is waiting for it: buyers below, sellers above, and how much each side brings.
On https://t.co/uMMOQ8xmDz you can:
• see bids and asks from ±1.5% out to ±60% for every Binance spot pair
• watch the whole market at once with TOTAL
• highlight the moments that matter with Condition Bands
• find the coins that match your conditions with the Screener
• get a Telegram alert when your conditions hit, so you don't have to sit in front of the chart
Here we post what the book is showing right now. Follow along, or open the site and look for yourself. The data there is always up to date.
Not financial advice.
@KillaXBT Part of that flush already happened: about $294M of longs were liquidated in the last 24h vs $21M of shorts. BTC bids within 3% of price on Binance spot are $86M vs $31M in asks. A wick is possible, but the book isn’t empty below. NFA
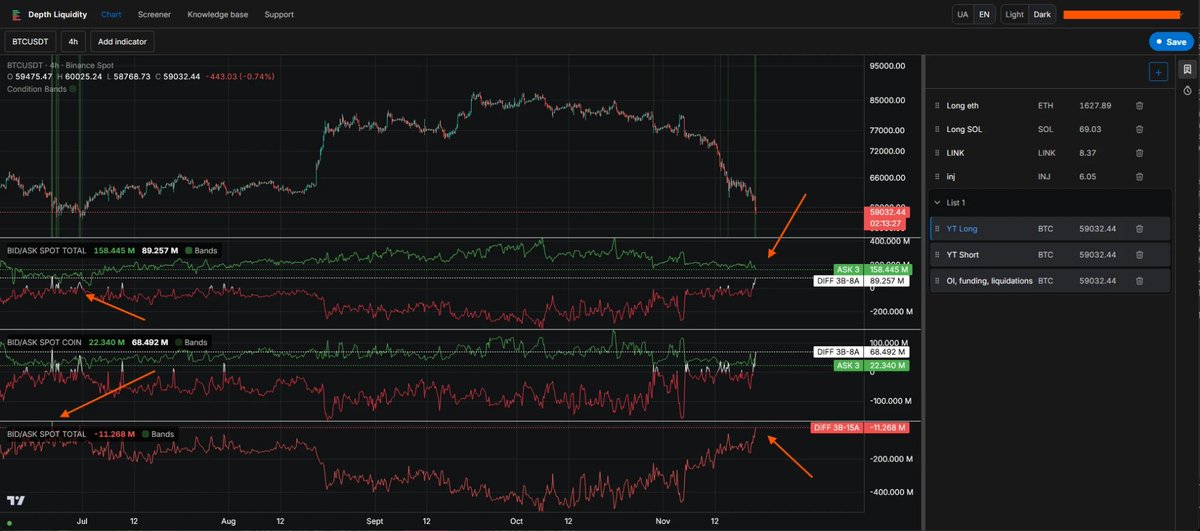
Bitcoin's order book is flashing an anomaly.
Across all Binance spot pairs, buyers within 3% of the price now outweigh sellers out to 8% by about $90M.
Sellers aren't backing off, though. They keep pressing the price lower.
What we're waiting for: sellers within 3% dropping below that gap (diff 3b-8a) across the whole market. On the chart it shows up as a white zone. The last time the whole market printed one was in June, near the summer bottom.
Follow for more reads like this, or build your own setup at https://t.co/uMMOQ8xmDz.
Not financial advice.
Bitcoin's order book is flashing an anomaly.
Across all Binance spot pairs, buyers within 3% of the price now outweigh sellers out to 8% by about $90M.
Sellers aren't backing off, though. They keep pressing the price lower.
What we're waiting for: sellers within 3% dropping below that gap (diff 3b-8a) across the whole market. On the chart it shows up as a white zone. The last time the whole market printed one was in June, near the summer bottom.
Follow for more reads like this, or build your own setup at https://t.co/uMMOQ8xmDz.
Not financial advice.
Bitcoin's order book is flashing an anomaly.
Across all Binance spot pairs, buyers within 3% of the price now outweigh sellers out to 8% by about $90M.
Sellers aren't backing off, though. They keep pressing the price lower.
What we're waiting for: sellers within 3% dropping below that gap (diff 3b-8a) across the whole market. On the chart it shows up as a white zone. The last time the whole market printed one was in June, near the summer bottom.
Follow for more reads like this, or build your own setup at https://t.co/uMMOQ8xmDz.
Not financial advice.
@rektcapital The book doesn’t fully back the bearish read yet. BTC bids within 1.5% of price on Binance spot are about $42M vs $20M in asks, so sellers aren’t the heavy side right now. NFA
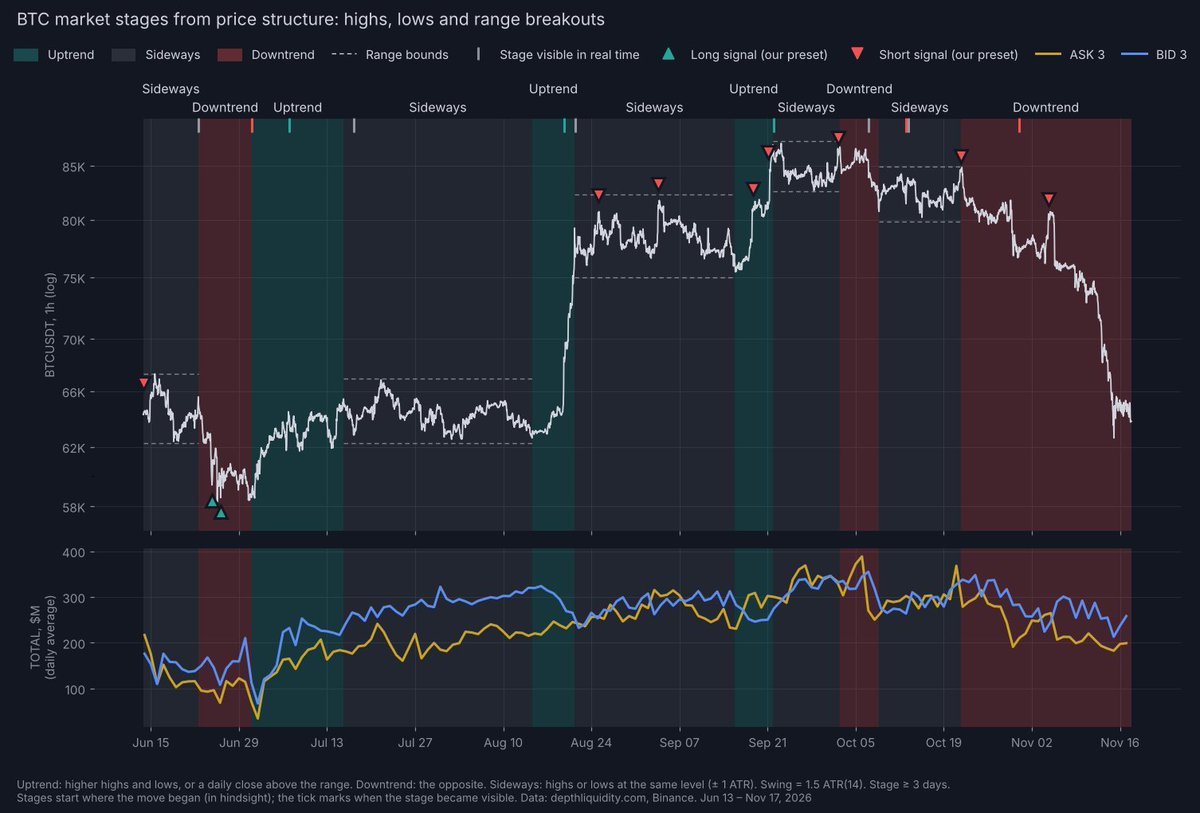
We built two signals right on our chart, one for longs and one for shorts, and marked every time they fired since June. #Bitcoin
Each signal is a few BID/ASK conditions saved as a preset. The long one fires when buy orders near the price clearly outweigh sell orders, on BTC and across all Binance spot pairs at the same time. The short one fires when sellers near the price take over at several depths at once, across the whole market.
The background shows the market stage, read from price structure. The book backs it up: sell orders grew in every uptrend and are melting in the current drop.
What history shows: longs fired only twice, both at the late June lows. Shorts kept showing up through the August to October run, and from early October each new one came at a lower high. The last one fired right before the November drop.
These are our rules, not the only ones. Pick your own conditions, see where they fired on history, save them as a preset and set an alert.
Follow for more reads like this, or build your own signal at https://t.co/uMMOQ8xmDz.
Not financial advice.
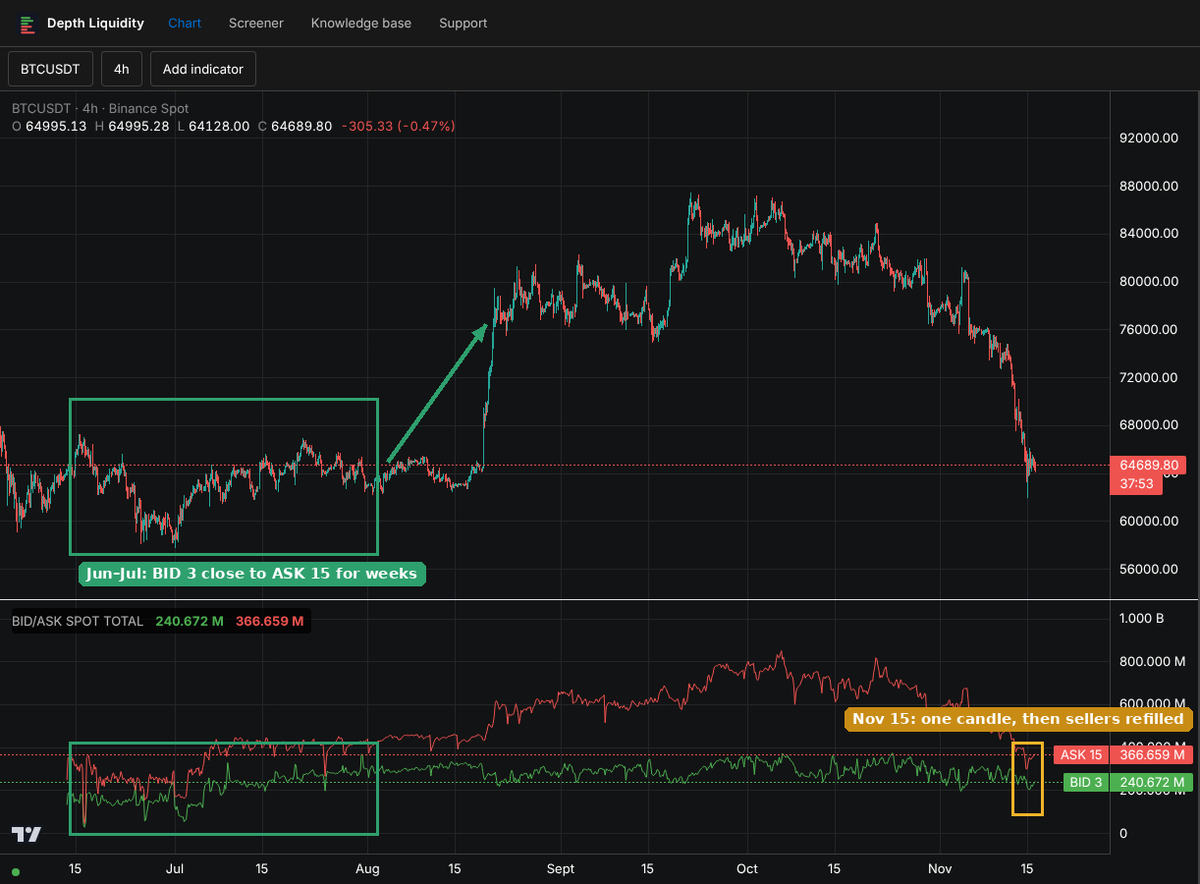
Across all Binance spot pairs, buy orders within 3% of the price just came close to sell orders sitting 15% above it. #Bitcoin
Normally the far sell side is much bigger. When buyers near the price almost match it, pushing the market down takes more selling than pushing it up takes buying.
In our data this setup held for weeks only once. Late June into July, BTC stuck in the low 60Ks, and BID 3 stayed close to ASK 15 week after week. In mid-August BTC broke out and ran to 79K.
This time it lasted a single 4h candle. On Nov 15 the gap was the tightest since July, then the sell side refilled. And it narrowed mostly because sellers pulled orders, not because buyers added.
BTC is back in that summer range, near 65K. If the buy side stays this close for days, not hours, it starts to look like June again. One touch isn't enough.
Follow for more reads like this, or watch BID 3 vs ASK 15 on the TOTAL chart at https://t.co/uMMOQ8xmDz.
Not financial advice.
Across all Binance spot pairs, buy orders within 3% of the price just came close to sell orders sitting 15% above it. #Bitcoin
Normally the far sell side is much bigger. When buyers near the price almost match it, pushing the market down takes more selling than pushing it up takes buying.
In our data this setup held for weeks only once. Late June into July, BTC stuck in the low 60Ks, and BID 3 stayed close to ASK 15 week after week. In mid-August BTC broke out and ran to 79K.
This time it lasted a single 4h candle. On Nov 15 the gap was the tightest since July, then the sell side refilled. And it narrowed mostly because sellers pulled orders, not because buyers added.
BTC is back in that summer range, near 65K. If the buy side stays this close for days, not hours, it starts to look like June again. One touch isn't enough.
Follow for more reads like this, or watch BID 3 vs ASK 15 on the TOTAL chart at https://t.co/uMMOQ8xmDz.
Not financial advice.
New on Depth Liquidity: Funding. It shows which side of the futures market is paying, across all Binance futures at once. #crypto
Every coin lands in one of four groups by its current funding rate:
Strongly negative: shorts pay noticeably
Negative: shorts pay a little
Positive: longs pay a little
Strongly positive: longs pay noticeably
The lines show what share of the market sits in each group. Count by number of coins, or weight by open interest so the big coins matter more.
The two strong groups show the mood of the crowd. Read them over a stretch of days, not by a single spike.
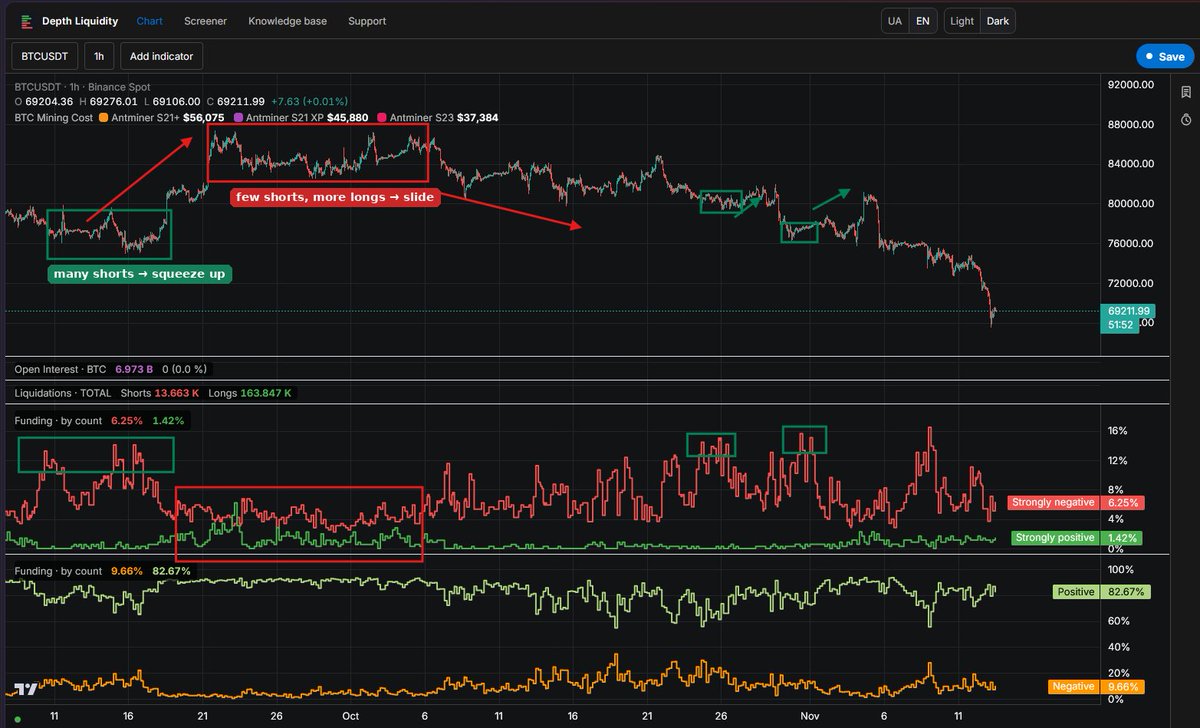
Mid-September, Strongly negative stayed high for more than a week. Lots of traders paid to stay short while price chopped around 76K. Then the shorts got squeezed and BTC ran to 87K.
Late September into early October the picture flipped. Shorts thinned out, the strongly positive group grew, and price stalled near the top. Then it slid.
The shorter clusters of shorts in late October played out the same way on a smaller scale, each followed by a bounce.
When the crowd leans hard to one side for a while, the market often moves against it. Not every time, so always check it against price and the order book before acting on it.
Right now Strongly negative sits low, around 6%, even after the drop to 69K. The crowd isn't shorting this market hard, so there's little fuel for a squeeze. For a real bounce we'd want to see that group grow and hold for a few days.
Follow for more reads like this, or add Funding to your own chart at https://t.co/uMMOQ8wOO1.
Not financial advice.
New on Depth Liquidity: Funding. It shows which side of the futures market is paying, across all Binance futures at once. #crypto
Every coin lands in one of four groups by its current funding rate:
Strongly negative: shorts pay noticeably
Negative: shorts pay a little
Positive: longs pay a little
Strongly positive: longs pay noticeably
The lines show what share of the market sits in each group. Count by number of coins, or weight by open interest so the big coins matter more.
The two strong groups show the mood of the crowd. Read them over a stretch of days, not by a single spike.
Mid-September, Strongly negative stayed high for more than a week. Lots of traders paid to stay short while price chopped around 76K. Then the shorts got squeezed and BTC ran to 87K.
Late September into early October the picture flipped. Shorts thinned out, the strongly positive group grew, and price stalled near the top. Then it slid.
The shorter clusters of shorts in late October played out the same way on a smaller scale, each followed by a bounce.
When the crowd leans hard to one side for a while, the market often moves against it. Not every time, so always check it against price and the order book before acting on it.
Right now Strongly negative sits low, around 6%, even after the drop to 69K. The crowd isn't shorting this market hard, so there's little fuel for a squeeze. For a real bounce we'd want to see that group grow and hold for a few days.
Follow for more reads like this, or add Funding to your own chart at https://t.co/uMMOQ8wOO1.
Not financial advice.
@CryptoMichNL The book looks like sellers are running out. NEAR bids within 3% of price on Binance are about $1.7M vs $1.0M in asks, and the ask side shrank a lot over the day. NFA
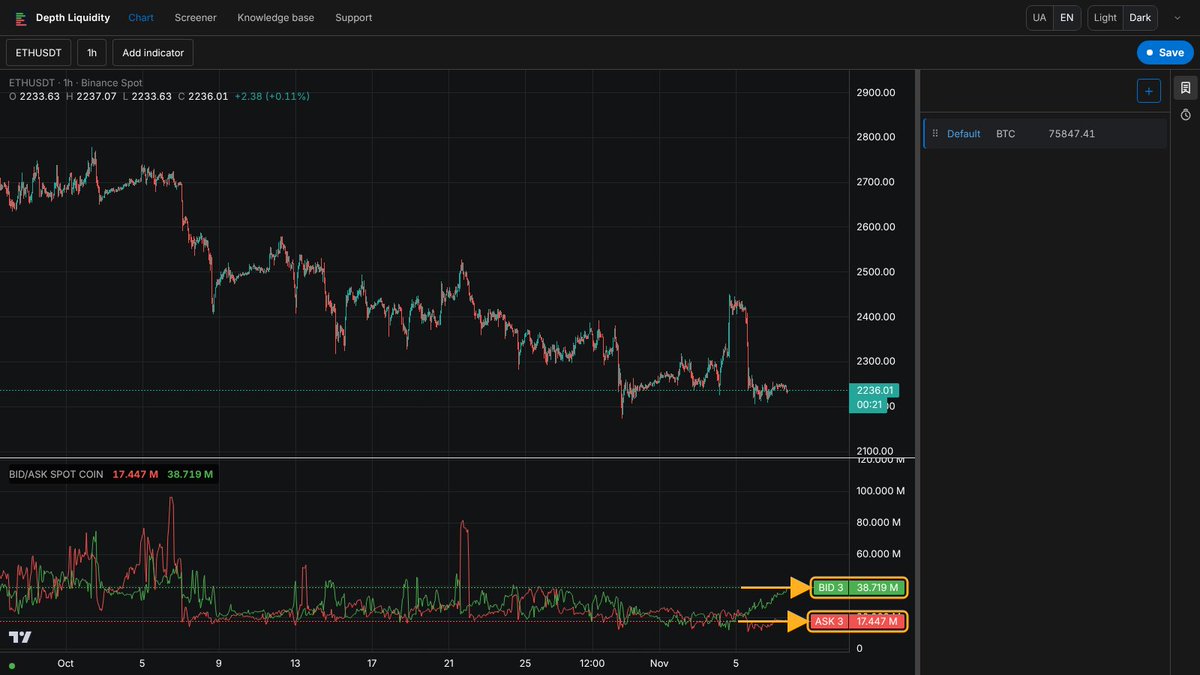
@CryptoTony__ Not much is standing in the way of that leg. ETH asks within 3% of price on Binance are about $17M vs $39M in bids, more than two to one. NFA
Buyers keep stepping into the BTC order book. Funding says the move up still lacks fuel. #Bitcoin
Our BID/ASK signal is on again: buy orders within 3% of the price outweigh sell orders within 8%. Buyers are absorbing the drop, just lower than last week, now around 75.5K.
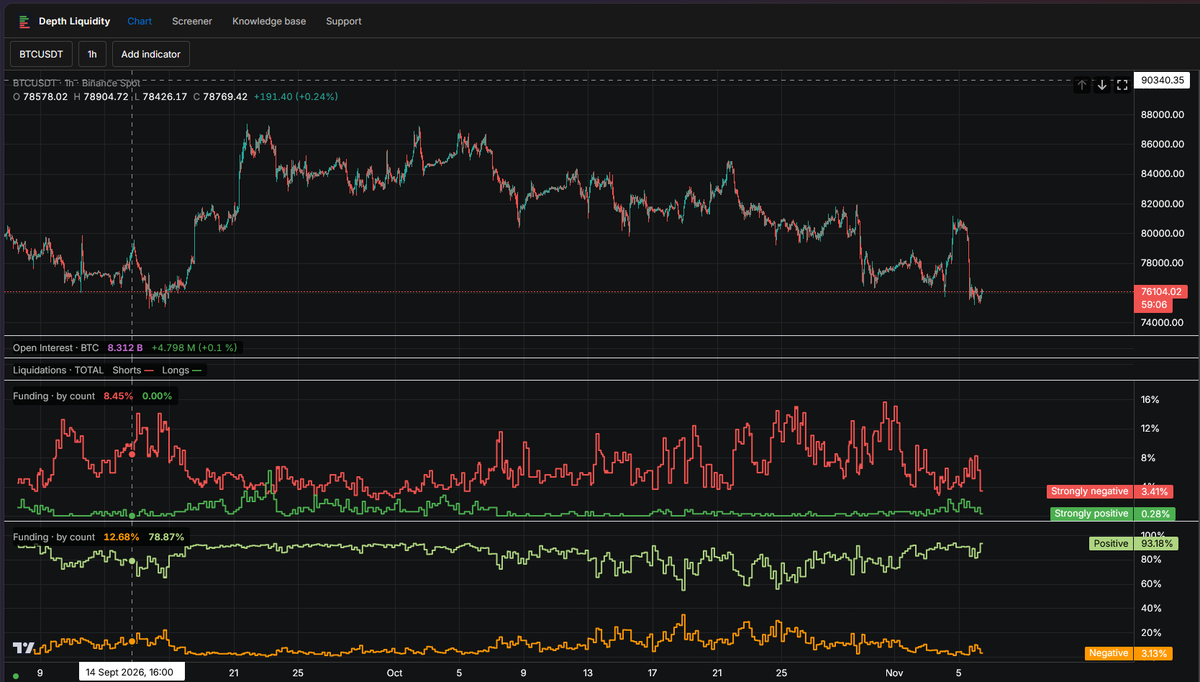
The other half of the picture is funding. Fewer than 4% of Binance futures have strongly negative funding, the group where shorts pay noticeably. In late October that group was several times bigger. Almost the whole market now sits in the mildly positive group.
Why it matters: a sharp move up usually needs crowded shorts that get squeezed. Right now there's hardly anyone to squeeze, so the buyers in the book have to do all the lifting.
First chart: BID/ASK, green bands are the hours the signal was on. Second: funding by coin count.
Until that red line climbs, we read this as support, not the start of a rally.
Not financial advice.
@CryptoMichNL Liquidations back that up: about $121M in BTC longs got wiped over the day vs $11M in shorts, and OI dropped almost 7%. Leverage got flushed while spot bids stacked up. NFA