Are you feeling the heat too?🥵
A heatwave is driving temperatures far above average across much of Western Europe and the UK, with record May temperatures reported in several countries.
This map shows land surface temperatures across Europe, using @CopernicusEU Sentinel-3 data from 26 May 2026.
🔗https://t.co/lsHPiYeKVO
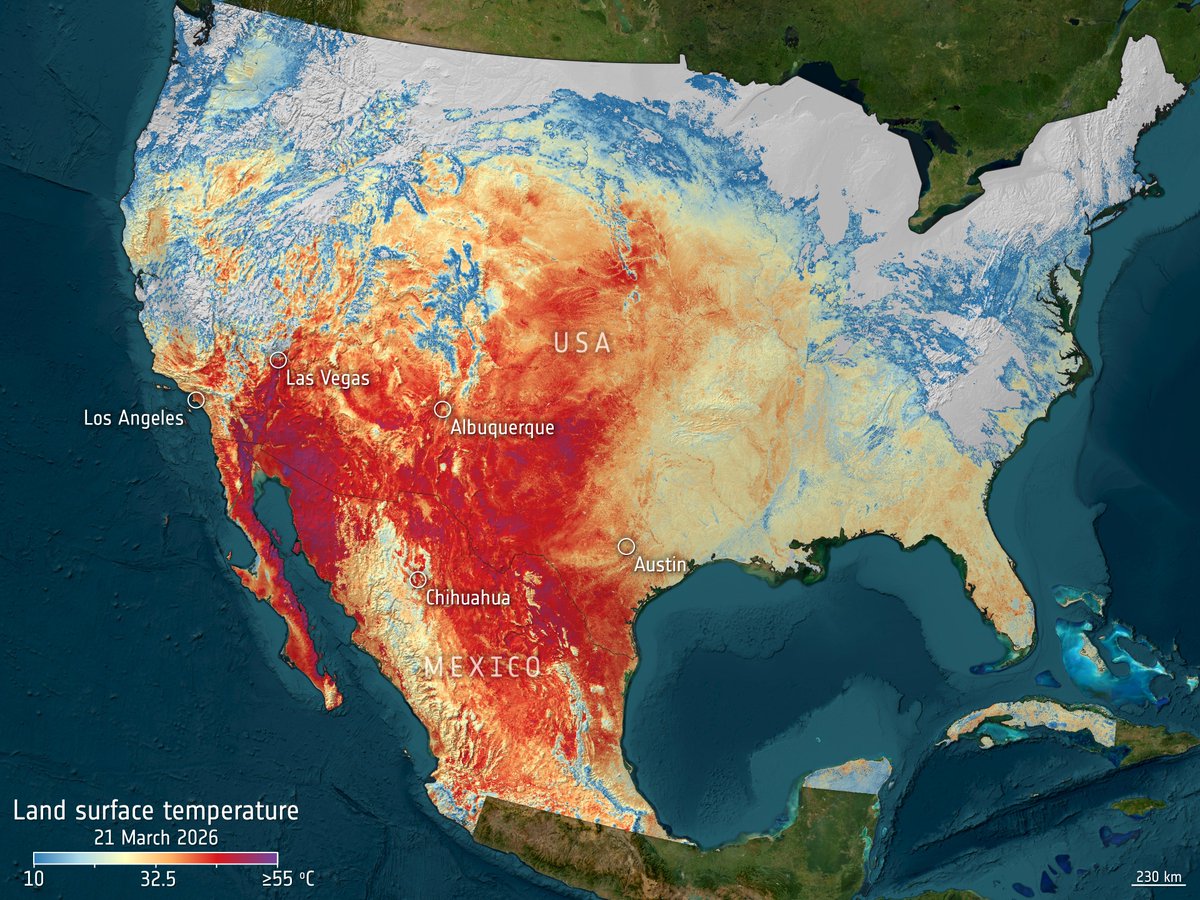
It's hot - and we can "see" it from space: On 21 March, Copernicus Sentinel-3 measured widespread land surface temperatures exceeding 40°C🥵
Recent extreme heat across the central and southwestern US and Mexico pushed ground temperatures far above seasonal norms according to @NOAA data.
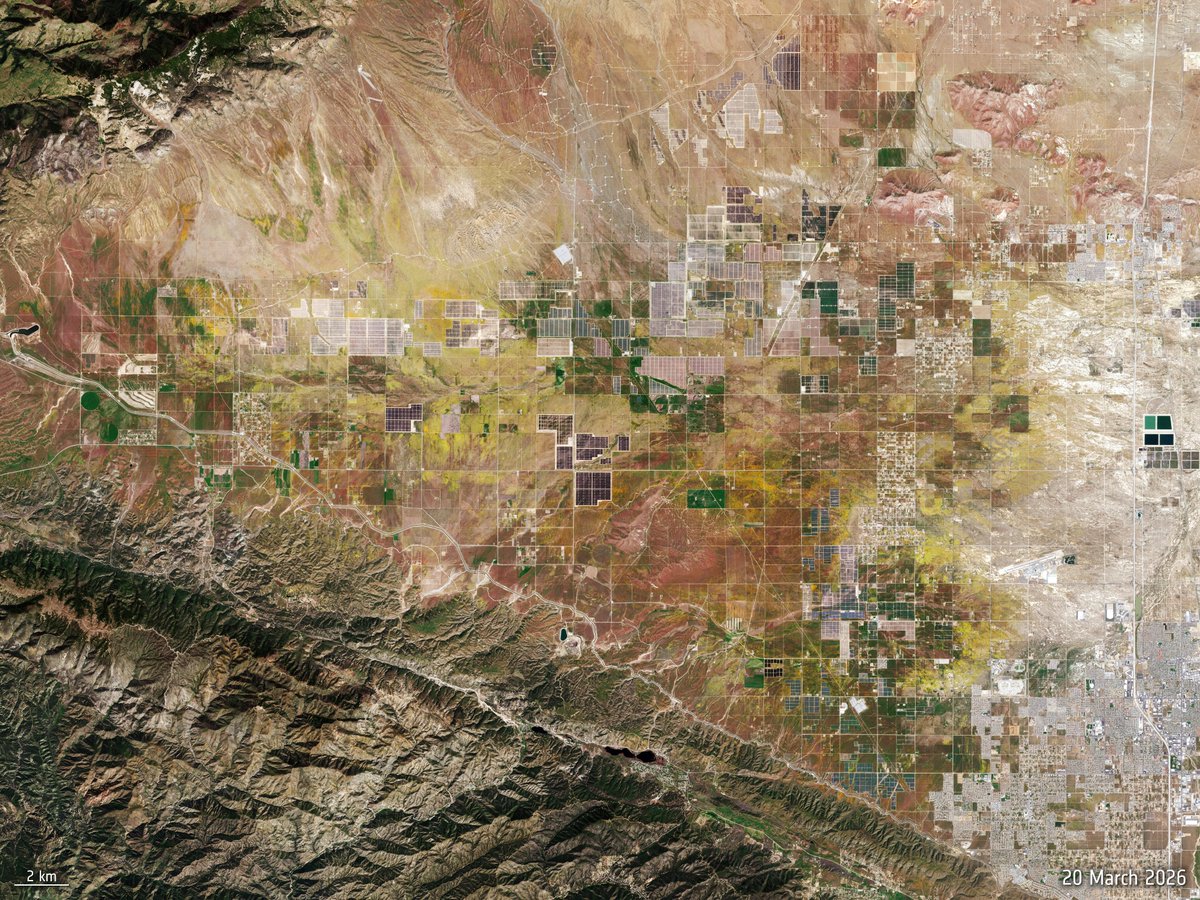
These extreme temperatures and winter rain have triggered a super bloom in some areas. On 20 March 2026, satellites captured expanded flower cover across Antelope Valley and Grass Valley — a rare burst of colour driven by the same unusual conditions.
France has endured 35 consecutive days of rain.
One striking example:
According to @Vigicrues, the Garonne at Marmande rose from 3.50 m on 10 February to over 10 m by 14 February.
Here are 3 images that show the impact of the heavy rainfall from space:
• Accumulated rainfall map (9–18 February 2026) using data from the @NASA/@JAXA_en GPM mission
• Sentinel‑1 radar image (flooded areas in red)
• Sentinel‑2 true‑colour view of the same region
Our thoughts are with the communities affected as the region continues to face challenging conditions.
What does the latest research tell us about Earth's changing climate?
The '10 New Insights in Climate Science 2025' report highlights ten key findings, including accelerating ocean warming, record‑breaking global heat and reduced carbon uptake on land.
Read more:
https://t.co/TffwQvuH5o
📹contains modified Copernicus Marine Service data (CNR, Buongiorno et. al.), processed by ESA
Three winter storms — Kristin, Leonardo and Marta — soaked the Iberian Peninsula in early 2026.
🌧️ Rainfall maps show areas in Portugal and Spain receiving 250+ mm in a week.
🌊 Copernicus Sentinel‑1 radar reveals major flooding along Portugal’s Tejo River, comparing Feb 2026 to pre‑storm conditions.
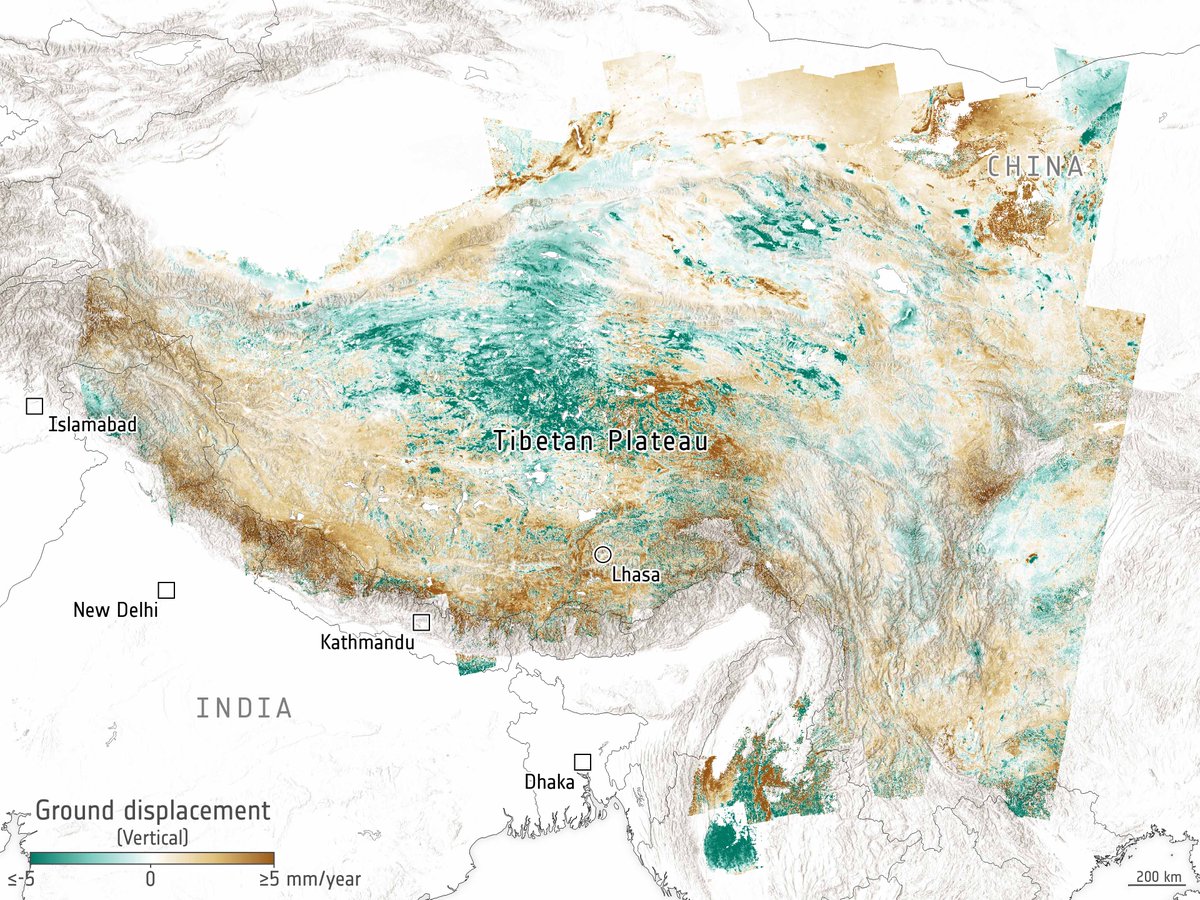
What if tectonic plates aren’t as solid as we thought?
Thanks to satellite data from @CopernicusEU Sentinel-1 and other data sources, scientists have mapped how the Tibetan Plateau stretches and shifts, showing that Earth’s crust and upper mantle behave more like flowing material.
📸ESA (Data source: Wright, T. et al, 2026)
https://t.co/wSLNLhorZD
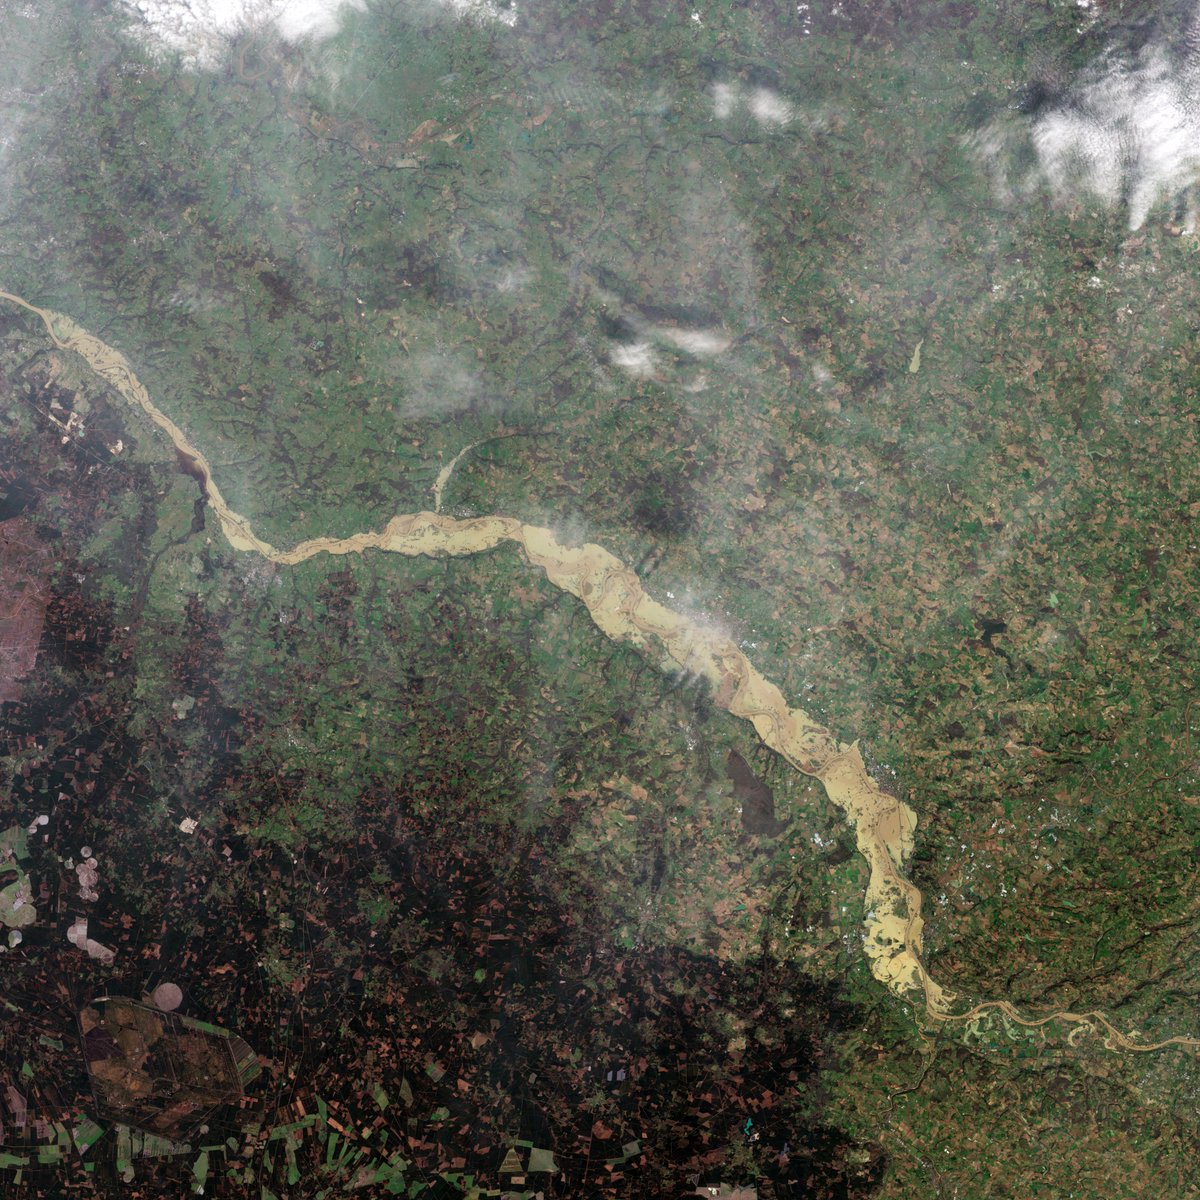
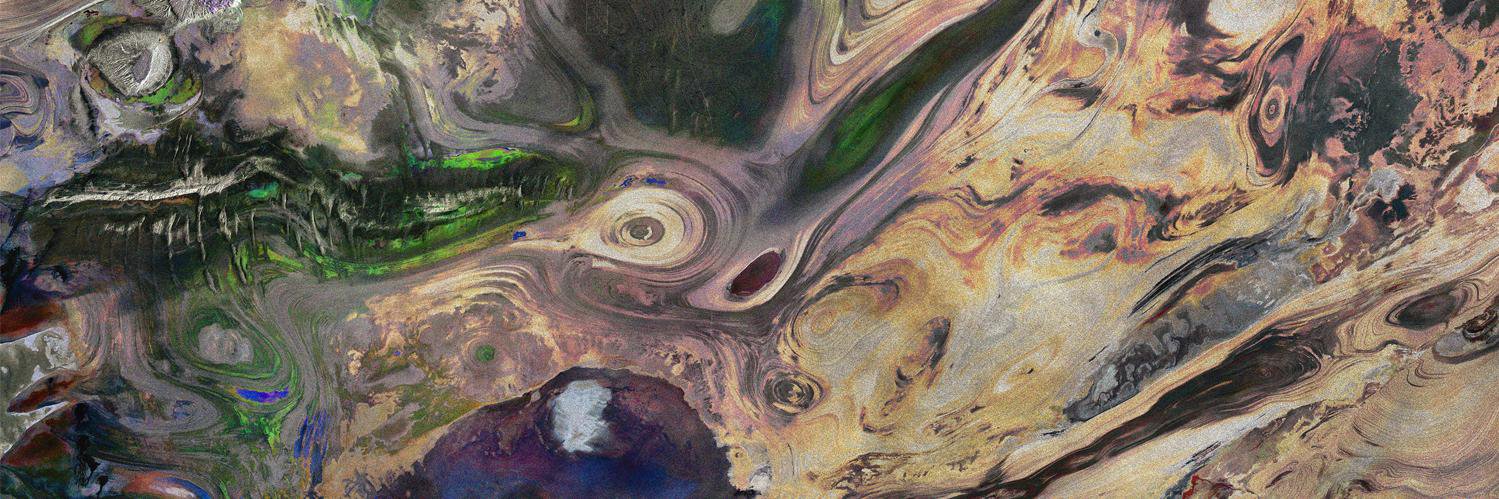
A coastal area shaped by river sediment
Seen here is part of Rudong County along China’s eastern coast, where sediment carried by the Yangtze River is discharged into the sea, giving the coastal waters a yellow-brown hue.
This fine sediment contributes to shape one of the world’s most dynamic and biodiverse river delta environments.
📸 @CopernicusEU
Australia’s record heatwave as seen from space 🌡️
Thermal data acquired by the @copernicus_eu Sentinel‑3 Sea and Land Surface Temperature Radiometer highlight the severity of the ongoing heatwave across Australia, with extreme land surface temperatures (LST) detected over large regions.
For example, in Willcania and Broken Hill, recorded land surface temperatures ranged between 58 and 60 °C, whereas Adelaide appeared cooler, with temperatures of 45–48 °C, likely due to its proximity to the sea.
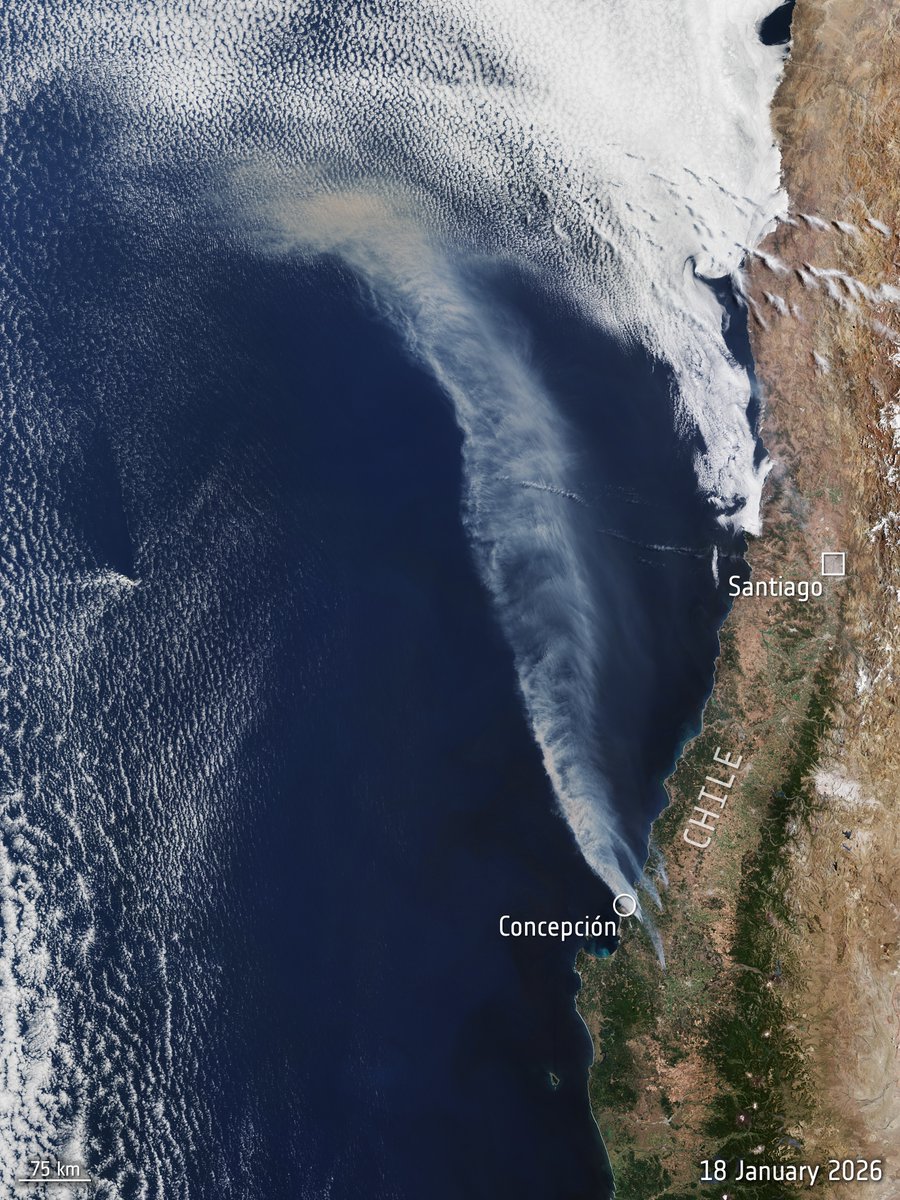
Forest fires in Chile as seen by @CopernicusEU Sentinel‑3 on 18 January - the image captured an extensive wildfire smoke plume originating near Concepción and sweeping over the Pacific Ocean.
According to @conaf_minagri , as of the evening of 19 January, emergency crews were actively responding to 31 wildfires nationwide.
Three decades of satellite data reveal a surprising culprit behind tropical carbon loss.
Using data from @esaclimate’s RECCAP-2 and Biomass projects, scientists found that small deforestation clearings – often under two hectare – are behind more than half of total losses since 1990.
https://t.co/7c0w9FIKLg
📸LSCE–Y. Xu/ESA
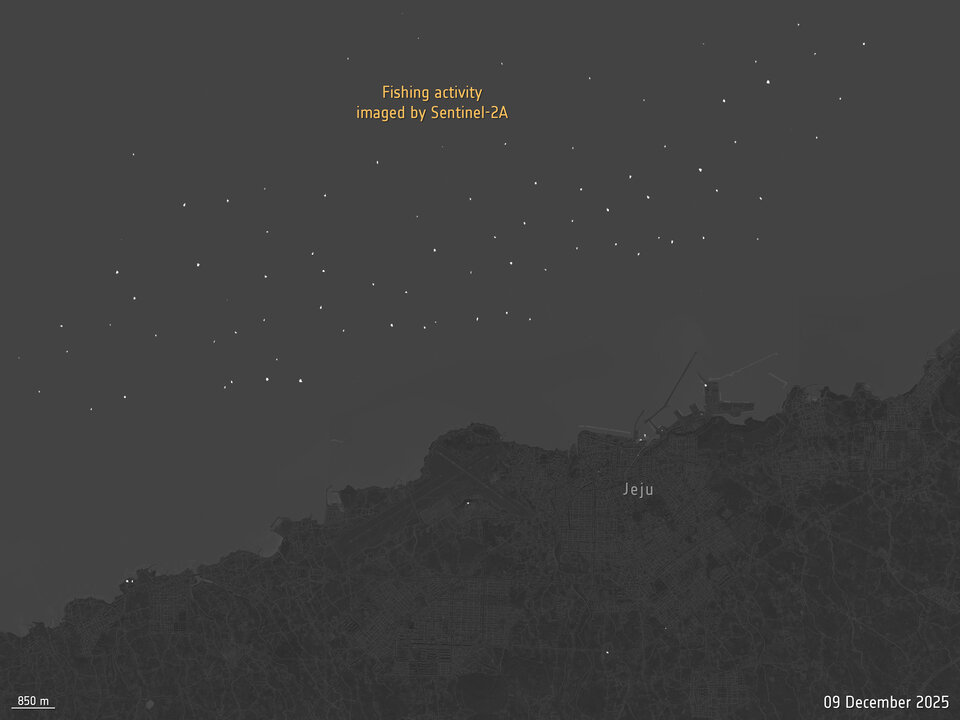
Snapshots of Earth after dark🌙
For the first time, @CopernicusEU Sentinel-2A has captured night‑time images of Earth, spotting gas flares in the Middle East, wildfires in India and even fishing boats in South Korea. The results from these tests are being used to prepare for Sentinel‑2 Next Generation.
https://t.co/GIBM1O2cGp
🆕 findings show how the clearance of small areas of forest accounts for more than half of net carbon losses across the Tropics: https://t.co/7c0w9FIKLg
The team behind the study is contributing to @esaclimate's RECCAP-2 and Biomass projects.
📸Clearing of tropical forest in Peru 1995–2020
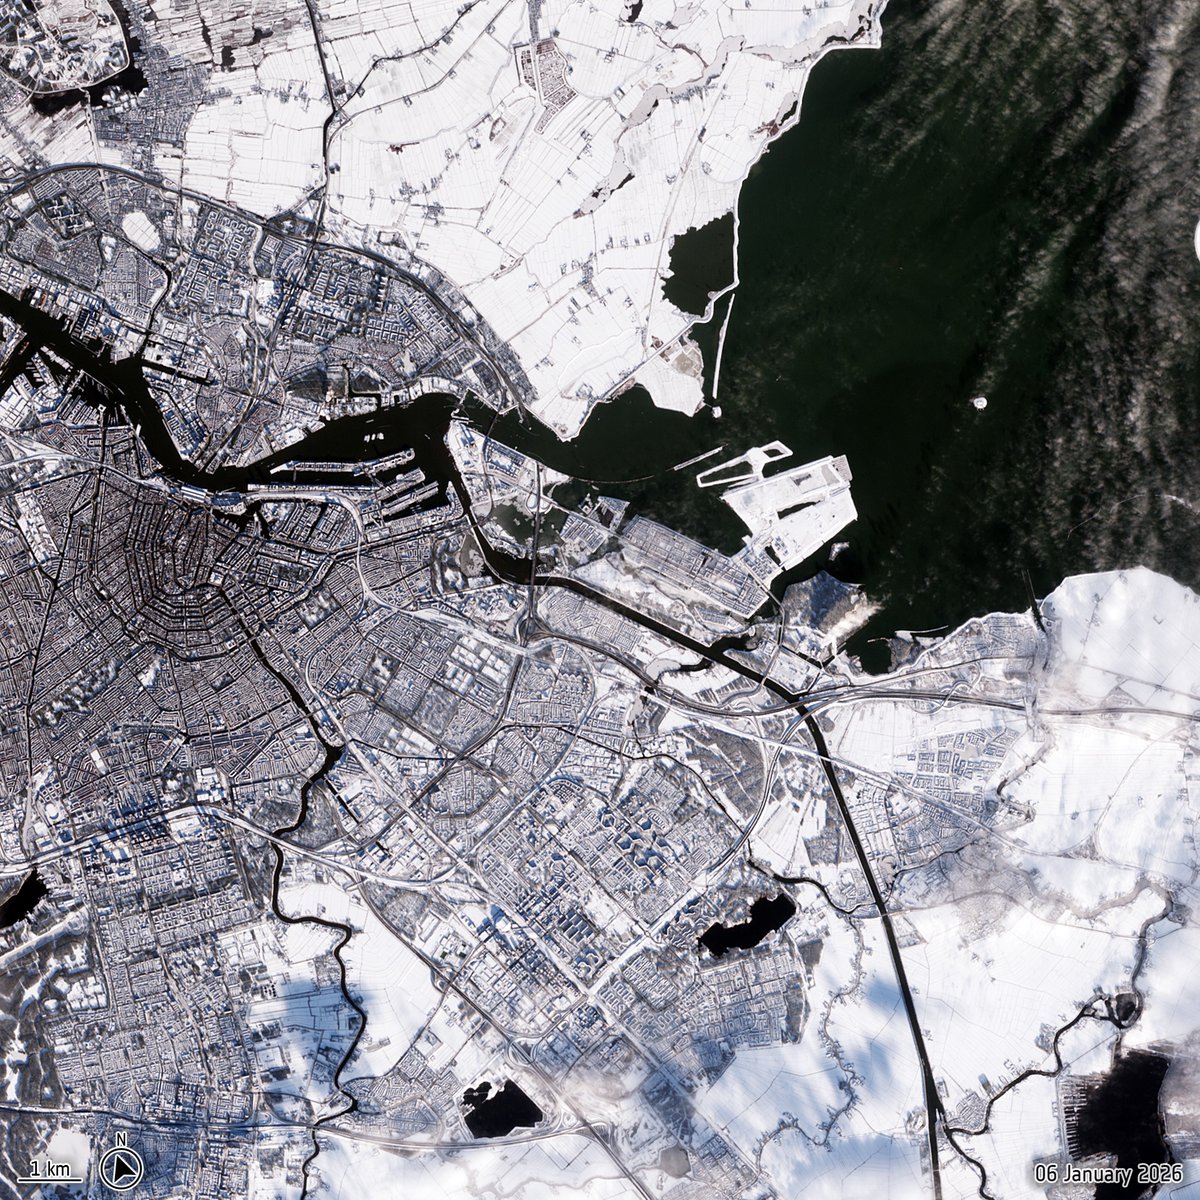
Snow day from space! ❄️
@CopernicusEU Sentinel-2 captured this view of Amsterdam blanketed in snow on 6 January.
The winter storm brought hazardous roads, travel disruptions, and numerous train and flight cancellations across the region.
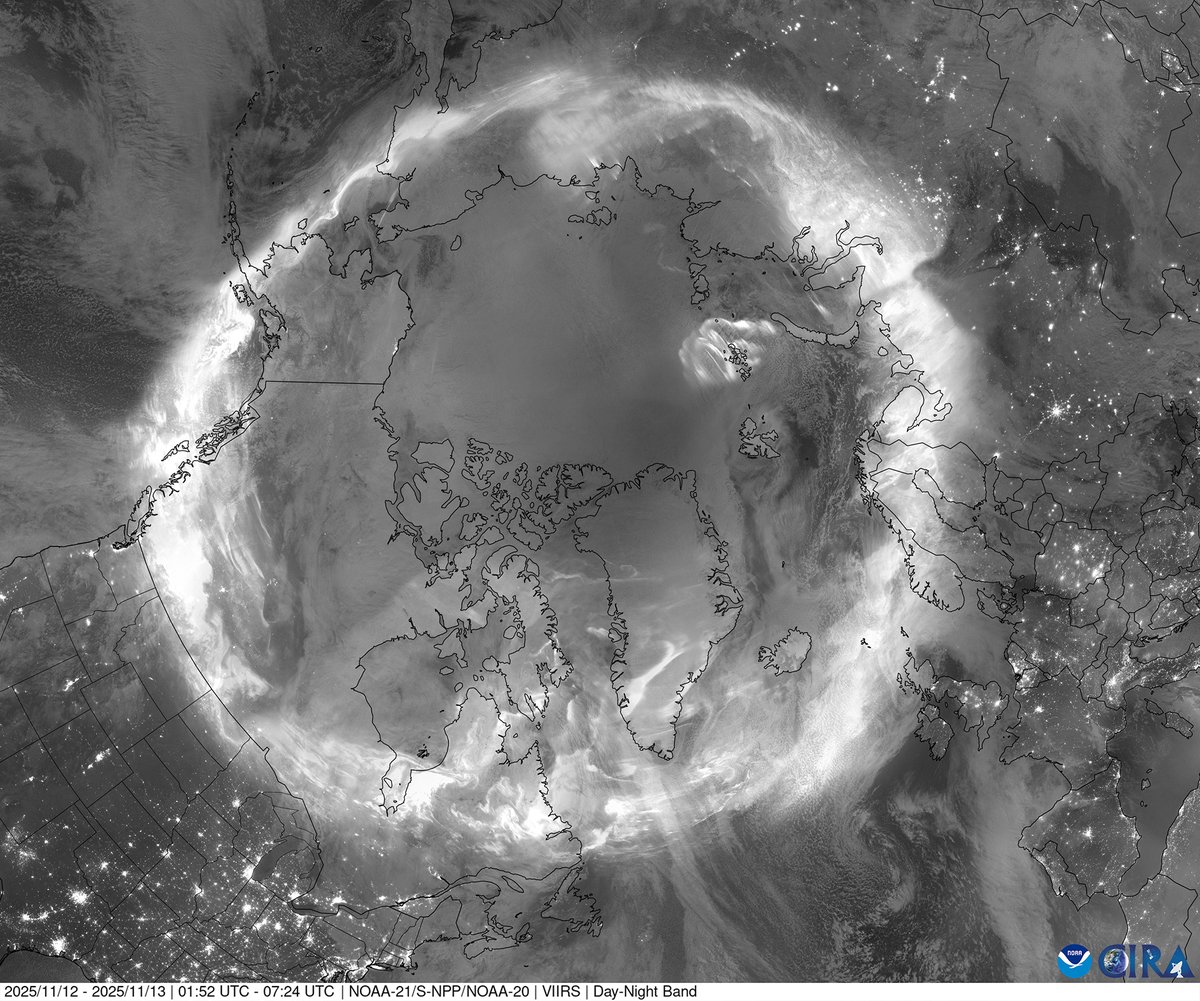
During the geomagnetic storm of 11–13 November, high‑energy proton flux spiked to 300× normal levels.
The @esa_swarm mission used its star‑tracker to detect this rare surge: https://t.co/9wHJYA0dZA
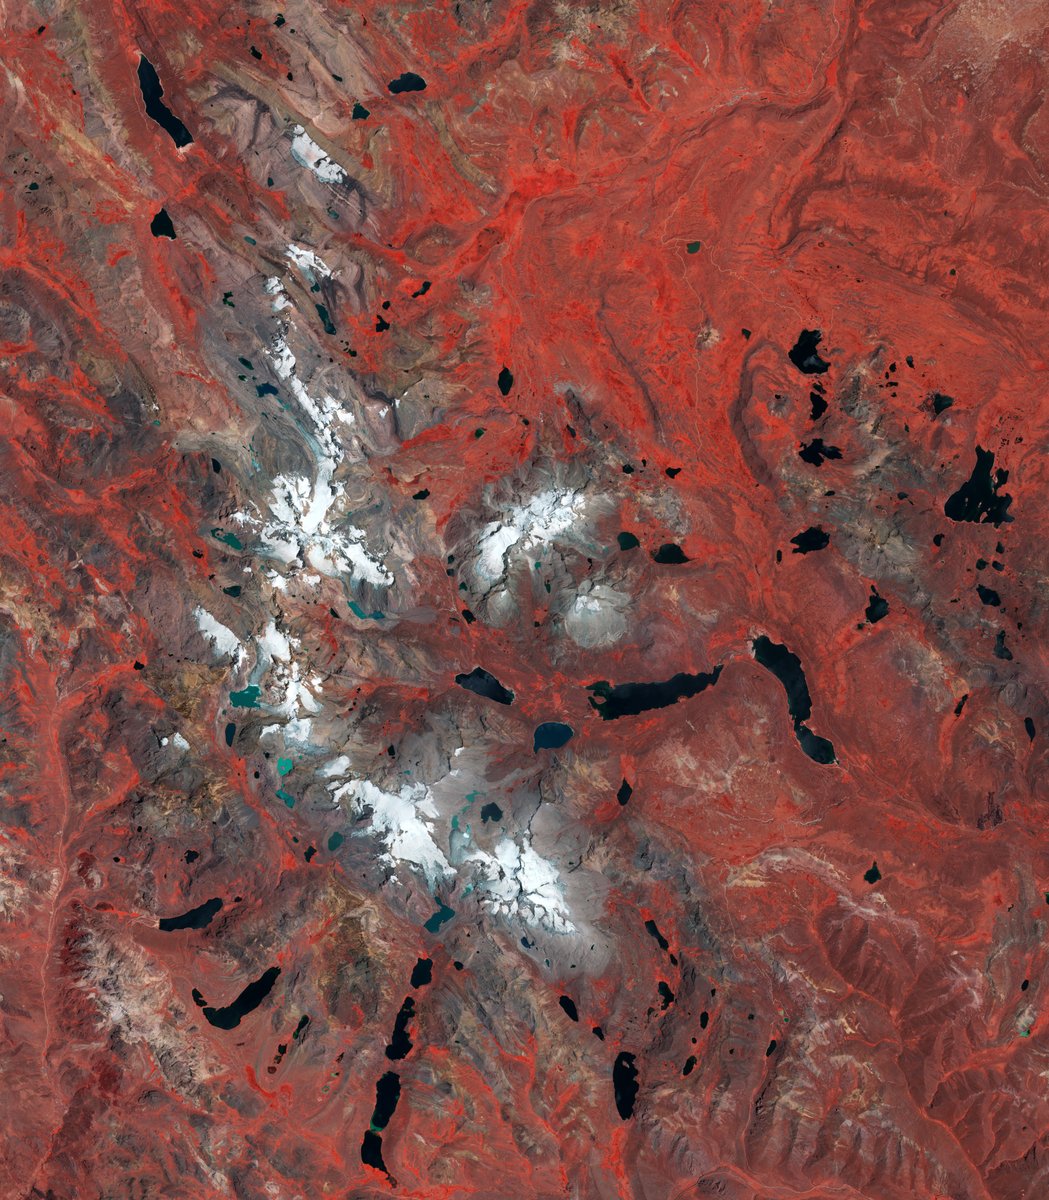
Pariacaca Mountain Range🇵🇪 in false colour.
Also known as the Huarochirí range, this rugged stretch of Peru’s central Andes is built from sharp peaks rising above 5000 m, the highest -Pariacaca- stands more than 5700 m above sea level.
📸@CopernicusEU
'Star trackers' turned storm trackers👀
During a geomagnetic storm in November, @esa_swarm detected a rare spike of high-energy protons at Earth’s poles with its 'star trackers', instruments normally used for satellite navigation and orientation. https://t.co/2zAcme0nZ4
📸CSU/CIRA & @NOAA
A multitemporal @CopernicusEU Sentinel-1 image of Sri Lanka - it stitches together two images, one from 26 November and one from today 2 December.
The flooded areas are clearly visible in blue - Sentinel-1’s radar ability to ‘see’ through clouds and rain, and in darkness, makes it particularly useful for monitoring floods.
The extent of the flooding in Sri Lanka's Puttalam region as seen from space.
The two images, from 31 October and 30 November, were captured by @CopernicusEU Sentinel-2.
The area is currently facing severe flooding, landslides and rockfalls, caused by heavy monsoon rains across the region: https://t.co/6KOAwx7vqN
A new @CopernicusEU Sentinel-5P image of the Hayli Gubbi volcano, one day after the eruption started.
This animation shows the plume of ash and sulphur dioxide spreading over an even wider area, drifting east, towards parts of the southwestern Arabian peninsula and beyond.
https://t.co/LlvZf7ZBKF
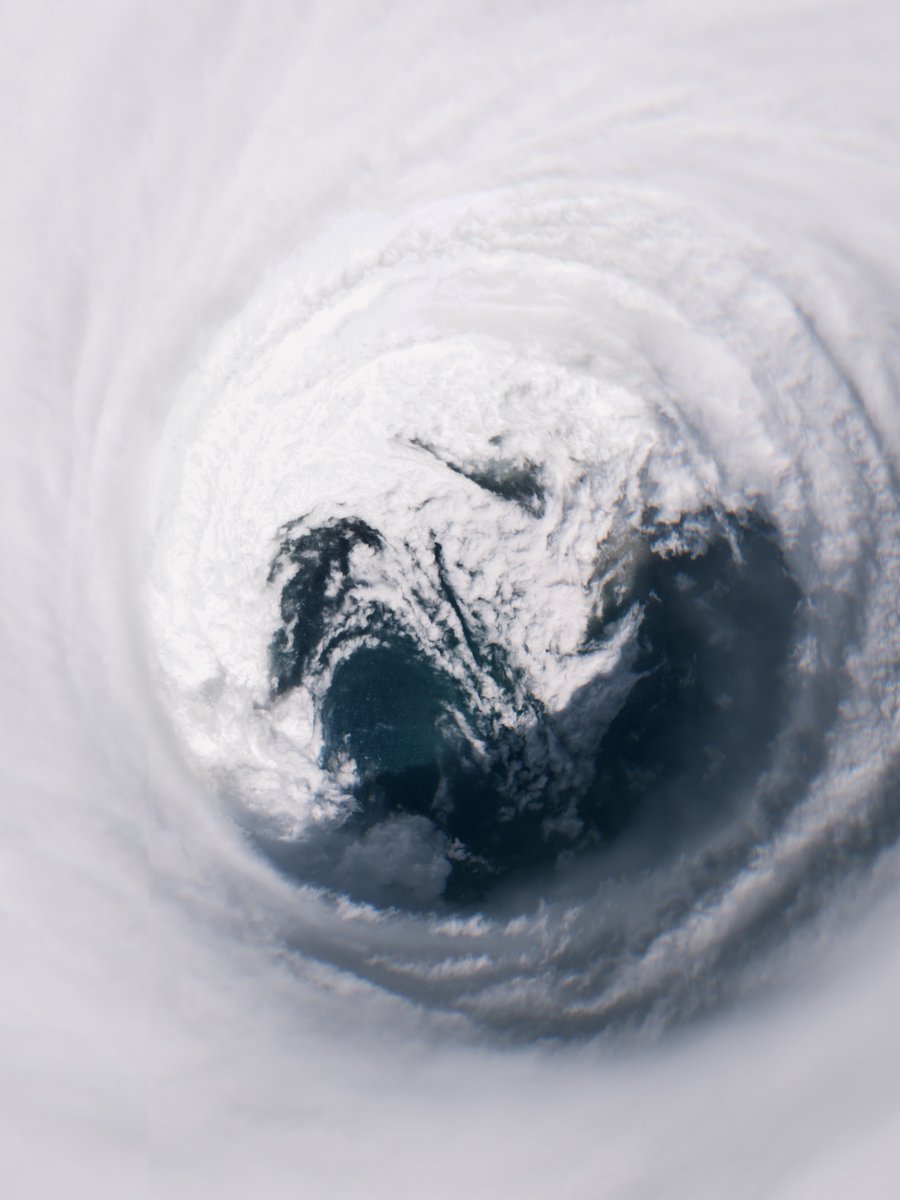
Captured by @CopernicusEU Sentinel satellites, these images show hurricane Melissa swirling over the Caribbean - currently the strongest tropical cyclone of the year worldwide.
Our thoughts are with everyone affected. Please follow guidance from local authorities and stay safe.
📸 Sentinel-2 (28 October)
📸 Sentinel-3 (27 October)