Home of bad surveys, bad data, and bad research. Good for a laugh or a cry. I usually tweet in between sob sessions. Tag or DM if you have something to share.
So how is "Other Activities Not Related to Research: 18%" related to "Other Activities Not Related to Research: 18%"? I've spent 100% of my time interpreting the results so far 😉
Today's adventure in survey taking: First, got past this tricky screener. As part of it, was asked my zip code. Then at 24% of the way through a 20 min survey (according to the progress bar), was termed for living in my state, WHICH YOU DAMN WELL KNEW BECAUSE OF MY ZIP! 😡🖕
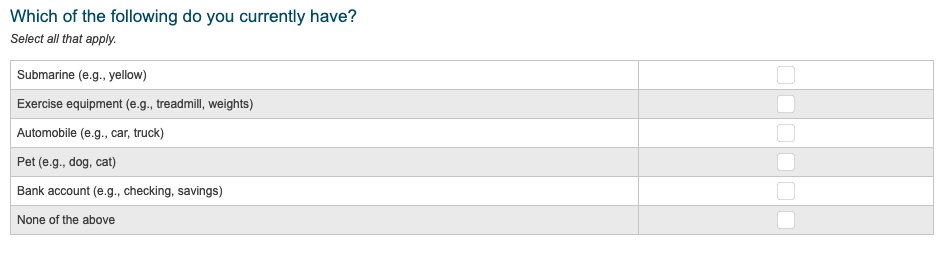
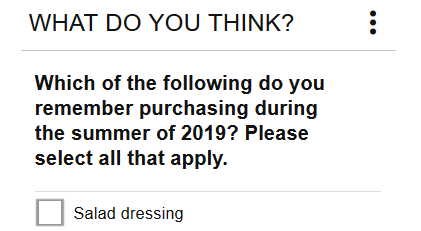
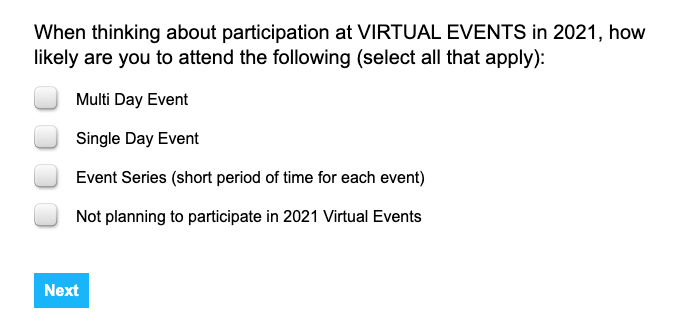
Ever since discovering @MRXShame and @BadSurveyQ I've been waiting to spot a bad question in the wild. Of course, it didn't take long. Spotted in a survey by the otherwise generally good @OpinionsForCash.
Help me understand this chart. Is it:
a) a half donut and supposed to be 50%...or 100%
b) a multi-select with no business being visualized in a chart like this
c) using the❗️to mean never show a chart like this
d) something else
@mediamath commissioned a survey of 1,000 individuals through @DynataGlobal to discover what users think about social media usage and ads they see there.
Majority of them consider that brands are at blame if their ads appear next to hateful content: https://t.co/lrgxJllOqu