@Hazukashi1 1996 ici et je comprends rien a l'informatique, j'ouvre une page word et j'écris dessus au stylo, je partage mon écran en l'envoyant au gens par la poste...
Mais par contre je sais télécharger de la RAM et faire des captures d'écran ( avec un filet de capture pour animaux) 😎
Globe interactif représentant 24h de flux aériens dans le monde (données ADS-B Exchange de septembre 2022) par Carlos Bergillos
https://t.co/V1wP724pNR
On February 20, 1970, Keith Sapsford, a 14-year-old Australian teenager, entered Sydney Airport and concealed himself in the wheel well of a plane bound for Japan.
Known for his curiosity, Keith saw this as an adventurous escapade. Tragically, not long after takeoff, he fell 200 feet to his doom.
Yeah This harrowing moment was inadvertently captured by John Gilpin, an amateur photographer, who was testing his new camera lens at the airport and took this poignant photo just before the calamity occurred.
📢 Les rencontres des utilisateurs francophones de QGIS auront lieu les 27 et 28 mars 2024 à Grenoble, en partenariat avec l'Institut d'Urbanisme et de Géographie Alpine.
Pensez à réserver ces dates !
L'appel à participation arrive bientôt, tenez-vous prêt ! #QGISFR2024
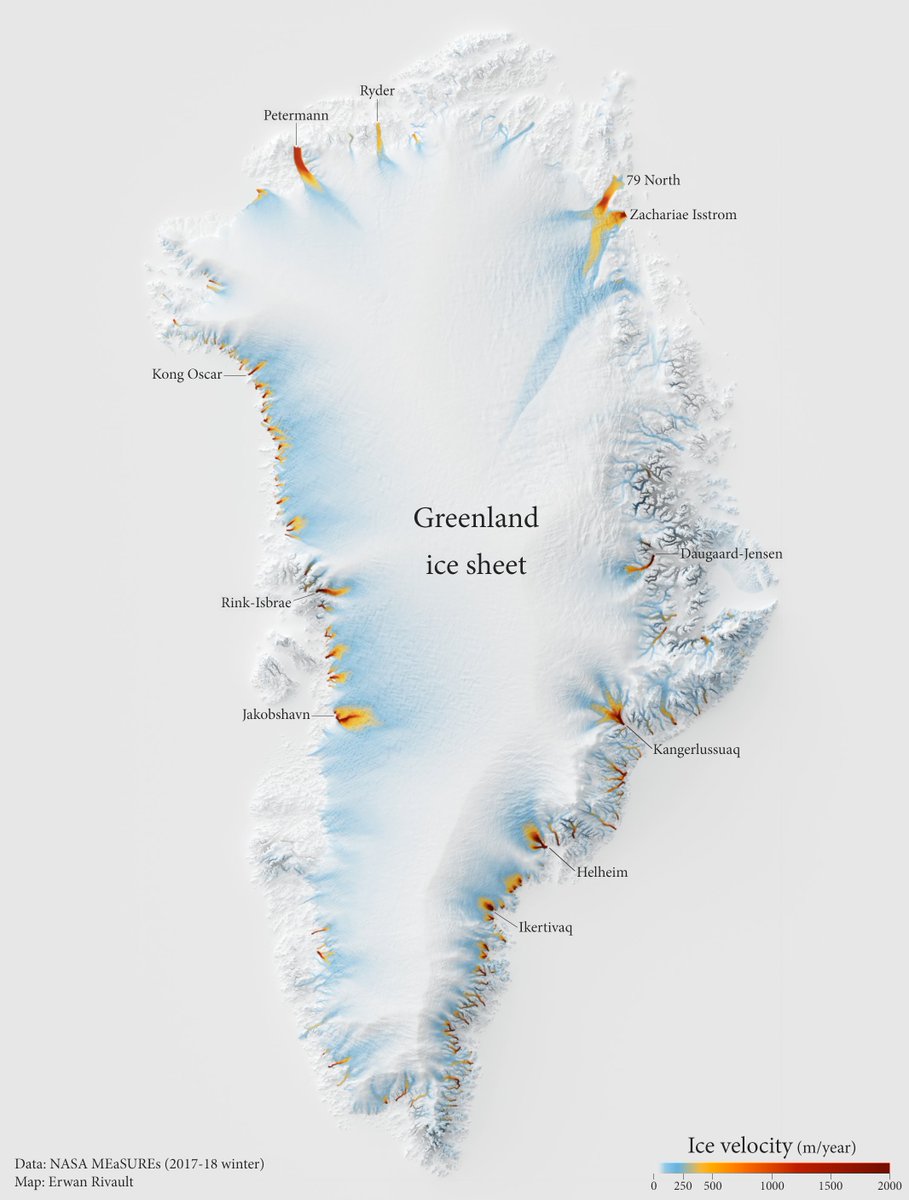
On me demande souvent (en vrai, de temps en temps) avec quels outils je bosse, et comment on réalise des infographies concrètement. Laissez-moi vous dire que cet intérêt pour la visualisation fait chaud à mon petit coeur.
Du coup, je vous explique ⬇️
@MapsByAntonia@anhsirkwijaya@LivingAtlas Amazing ! Is it from a DEM > Point grid> point grid join with dem data ? Just trying to understand the process :)
Hello #gischat !
I'm looking for a feature in QGIS about scale, to create a continous scale type.
My dataset is about windspeed, so I was moving toward this kind of representation but when I finish my map the only scale type is class value :/ Thx the help !
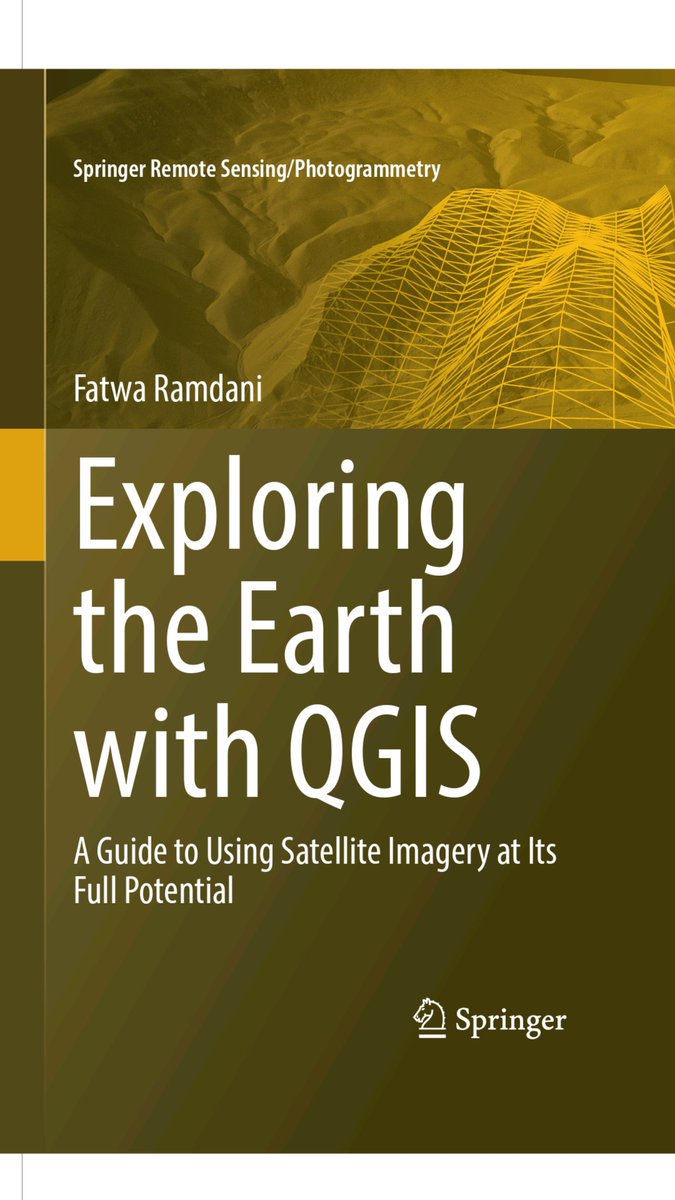
I am thrilled to share some exciting news with you. My book, titled "Exploring the Earth with QGIS: A Guide to Using Satellite Imagery at Its Full Potential," has recently been published by Springer.
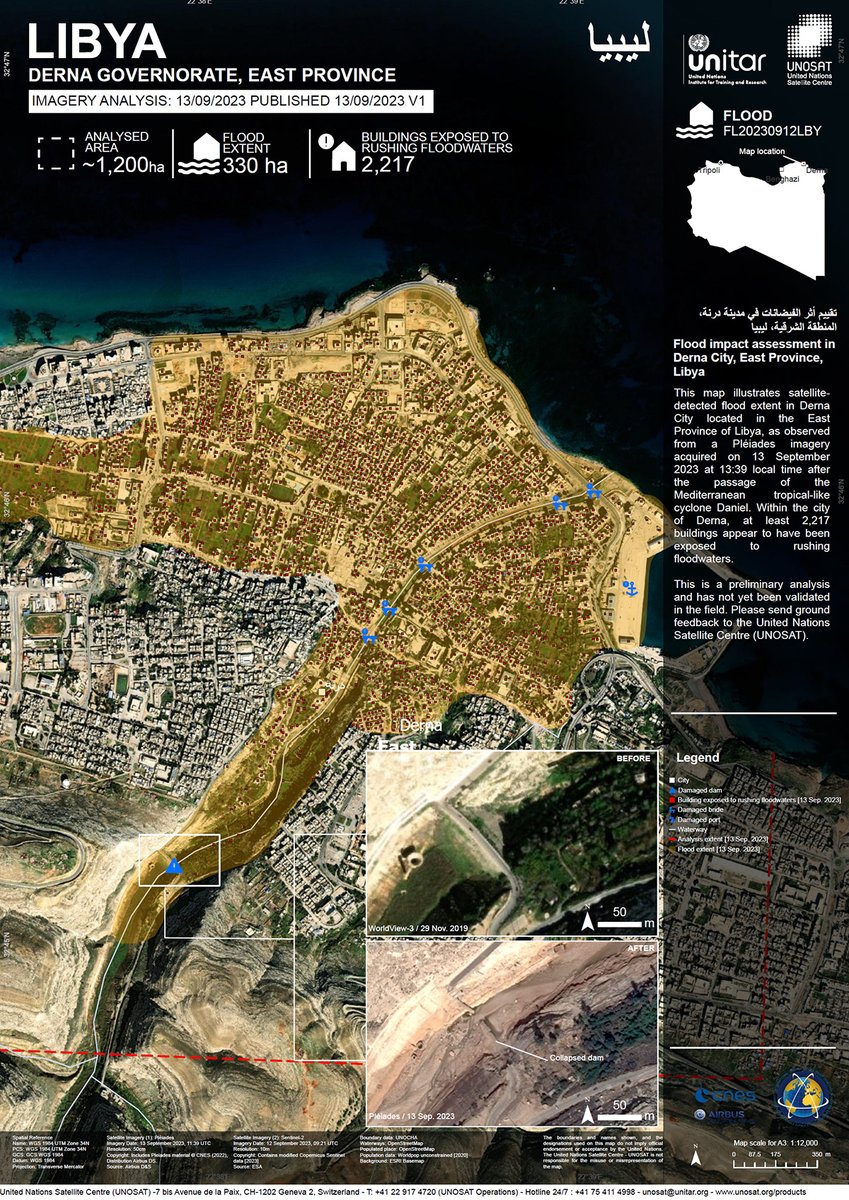
Our first map of the floods in #Libya uses imagery from #Sentinel2, #Pleiades and WorldView-2 to estimate the impact to Derna City after #StormDaniel: https://t.co/vunF2sGlNo