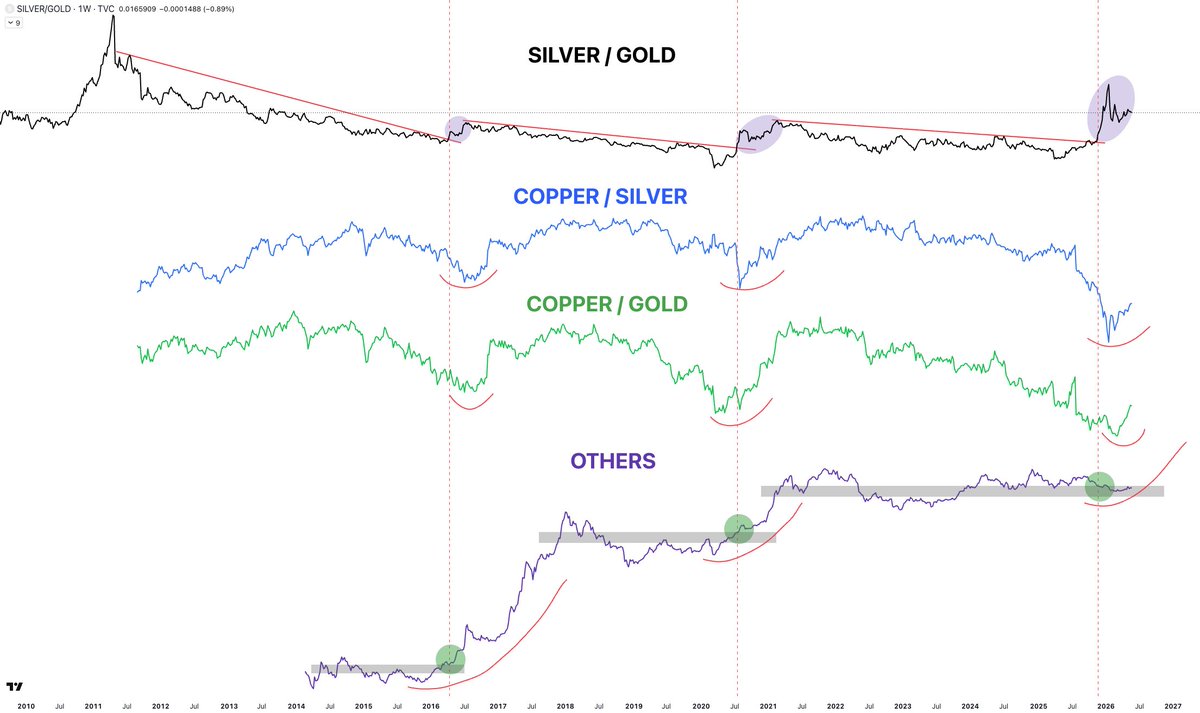
🚨 Hey guys, it’s Luca here.
For all of my followers on X, please read this message carefully.
As many of you already know, my account has been suspended for an indefinite period of time. Last night, I tried creating a new account, which was instantly banned after people started following me again, as my amazing collaborators saw the injustice and tried to support me.
Unfortunately, the system feels rigged. Posting original content, complex market correlations, and educational analysis every single day for the past 3 years was not enough. Dedicating my life to helping retail investors understand the markets was not enough. Exposing market manipulation, liquidity traps, and market maker behavior in order to save people from big losses was not enough.
Every one of my real followers knows how much I have dedicated to bringing value, education, and original content to investors. Many of you tried to vouch for me in the comments, through appeals, and through public support. My collaborators did the same.
But so far, nothing has changed.
I don’t know if I will ever get my account back. I’m still fighting through appeals, but from experience, once an account gets suspended, the chance of getting it back is very low.
3 years of hard work are now gone.
I’m still processing everything, but I don’t want to leave my audience hanging. As I said in a previous post after being demonetized and before getting banned, I never cared about the money. For the first 15 months, I wasn’t even monetized. I did this because I genuinely cared about sharing valuable research and helping people understand the markets better.
Because of this, until I can get my account back, I will post my regular content exclusively on the FREE Patreon.
The platform allows me to share content with free members, and all you have to do is join. This is my ultimate backup. I hope this ban is only temporary, but right now, there is no way for me to post on X from any account. I would not have reached out to my collaborators if this wasn’t a last resort. So for all of my followers, please join the Free Patreon to continue viewing my work.
I will keep sharing my content there every day.
And to all my collaborators and everyone who has supported me through this rough period, thank you. Seriously. I can’t wait to get back to our market talks, and keep bringing valuable content to everyone.
To all of my collaborators, please repost this so all of my followers can see this message and know where to find me.
Thank you.
@cantonmeow@matthughes13@LeaderInvests@Invst_Informant@dannycheng2022@StockTrader_Max@Freedom_By_40@chad_ventures@EWTracker@acethebulllly@realdanielnita@ChifoiCristian@mikealfred@MisterSpread
BITCOIN Bottoming process.
When you see people that provide great work, you should like, RT and QT if/so you can add value to it.
My brother Cristian here making great points, I would add to add the following :
Many know my love for SMAs, MAs, EMAs on top of onchain data (that I think it's key here (ndlr : supply in profit and loss currently saying the story on where we stand)).
History showed us that EVERY SINGLE time the MA 50 did cross the 100 during the bear market it was one of the greatest point to enter/accumulate the king of crypto.
Bottom was either IN (2015/2019) or very near (2022)
On top of it you could use in correlation the 200 SMA on the Weekly, I'll say it again and again, every single time price went below it was the best on the overall picture.
Issue is that most of our beloved crypto friends have left the space, moved to metals or TradFi (gays), bulls sadly have no voice no longer, people rather provide visibility on Ansem and his scams or even worse BEARS.
Bears got the visibility because most have pain inside them from the bear market (as they were not positioned for it (ndlr : by listening to the same people bearish now))
There are many signs, most just don't want to see it.
Bitcoin bottoming process [2]
Every bottom in the past was a deviation, and after the deviation happened:
1. Price picked up rapidly above the deviation line
2. Check back
3. Expansion rapidly after that
Caveats:
1. 2014 bear market: deviation lasted almost a year; but the 2012-2013 expansion was +53.000% -> longest bear market
2. 2018 bear market: hard deviation lasted 6 months; expansion before was 12.000%; price pick up was harder (+330%); breakdown after checkback, but black swan (closed above on the Monthly)
3. 2022 bear market: light deviation (light expansion in the past); price picked up 98%; fastest expansion after (ATH before halving)
2026:
I think this is the deviation, or we form another flagging structure here, and the deviation becomes 51k-ish
1. Price will pick up very fast afterwards
2. We should have a slowdown and check back - every trader will look for continuation to the downside, same exact as 2023 wanting new lows (or black swans like 2020)
3. Faster expansion than 2024 - I think new highs are due before summer 2027 ends
Will update in the future.
See the full video update, also checking alts charts, here:
https://t.co/qNnF7NiInt
You have a 7-day free trial.
Buckle up.
It's time for an in-depth thread on $ETH.
Many of you have already seen my thread on $BTC. If you haven't, make sure to read the quoted post first, as it explains many of the concepts I'll cover here as well.
Looking at Ethereum, we can see that over the last couple of months it has been doing almost exactly what Bitcoin has: forming a series of untapped lows on the low timeframes before continuing lower.
This is one of the main reasons why I remain bullish on Ethereum over the long run. Like Bitcoin, I believe this is how market makers are accumulating spot exposure while retail continues capitulating and selling into weakness.
As for the current market structure, the price has now tapped into the high-timeframe support range that marked the April 2025 bottoming formation. I believe this is where Ethereum is likely to form a more durable bottom over the coming days or weeks before reversing to the upside.
Some people are calling for sub-$1K $ETH. Personally, I don't see that as the most likely outcome. I believe the current area is a good accumulation zone on the high timeframes.
Yes, there could still be further downside on the low timeframes, but after such a prolonged high-timeframe downtrend, I believe the current risk-reward setup is starting to lean in favor of buyers.
Because of this, I remain bullish on Ethereum at these levels and believe the most likely outcome from here is a more durable reversal to the upside.
It's time for an in-depth update on $BTC.
This will be one of the MOST IMPORTANT threads you're going to read right now on Bitcoin, so make sure you check it out.
In my previous update, I highlighted that the most likely outcome was a final corrective Wave C on the low-timeframes before an eventual reversal to the upside.
This is exactly what we're currently seeing, as Bitcoin has just formed new lows today, dropping as low as $58K.
Because of this, I'm now starting to become more bullish on the low-timeframes.
This is the first time in weeks that I've taken a more decisive bullish stance, as I've started scaling out of the hedges I took following the breakdown below the high-timeframe support range aligning with the early-April 2025 lows at $77K.
I've started rotating that capital back into my spot holdings and re-accumulating in order to position for a reversal to the upside.
On the high-timeframes, this is something I've done multiple times. I hedge when key technical breakdowns take place, then scale out of those hedges once the price reaches major high-timeframe support ranges, and then repeat the process again.
It wasn't perfect, and I wasn't trying to predict the exact bottom. The goal was simply to protect my capital, mitigate downside risk, and gradually increase my spot position over time to position myself for an eventual reversal to the upside on the high-timeframes.
Now it's time to objectively discuss what comes next.
In my view, further downside remains the most likely outcome on the low-timeframes towards the high-timeframe support range at $55K-$56K, where I believe a more durable bottoming formation is likely to develop and where the corrective Wave C I've covered in prior updates is likely to complete.
"But Luca, if you expect more downside, why are you buying now?"
Because I don't care about perfectly timing the bottom.
I care about accumulating assets that I believe will be worth significantly more in the coming months and years.
I believe Bitcoin will be trading above current levels 12 months from now, and with a major high-timeframe support range sitting near the current price, I believe the risk-reward setup is becoming really good, with relatively limited downside compared to the potential upside.
But let's move away from the "bullish hopium" some of you may call, and let's look at the objective data.
Looking at liquidation data, we can see that on an 8% move either higher or lower, there are currently roughly five times more shorts than longs.
That tells us that most of the long liquidation has already took place and that the market is now heavily positioned on the bearish side.
But anyone can look at a liquidation chart.
The real alpha is in the Velo data.
That's where a very interesting setup is developing.
First, while the price has been falling, Open Interest has continued moving higher.
For those unfamiliar, Open Interest measures the total amount of open perpetual positions, so both longs and shorts.
At first glance, you could argue that these are simply desperate bulls doubling down on their longs to avoid liquidations.
But that's where Funding Rates become important, as they measure the ratio between longs and shorts.
Funding Rates have continued moving lower while Open Interest has increased.
That tells us that these are not aggressive longs entering the market.
They're aggressive shorts.
Bears are doubling down on their positions and betting on a continuation lower.
And while they may be right in the short term, I believe they will be very wrong on the mid-term.
But that's not even the most interesting part.
The most important confluence is coming from Spot Volume.
When we look at the price action over the last couple of days, every major downside wick that marked a local bottom also aligned with a spike in Spot Volume.
And that means buying pressure.
The type of buying pressure that only larger players can create on the low-timeframes.
While retail investors have been capitulating over the last couple of months, whales and institutional investors appear to be absorbing that sell pressure.
And this is where my broader thesis comes into play.
I believe that the series of rising wedges and untapped lows that have repeatedly developed on the low-timeframes have been part of a process designed to create an artificial counterparty.
This is a thesis I've discussed before.
In fact, I covered this exact same concept back in April of last year when Bitcoin formed a major bottom.
That thesis helped me identify the reversal and begin scaling out of hedges while rotating capital back into spot holdings, the same thing I'm doing right now.
This is the thread I shared at the time:
https://t.co/XQbySirHXJ
Today, we're seeing a very similar structure.
A series of untapped lows developing on the low-timeframes, followed by liquidation cascades that liquidate impatient investors and specifically retail traders.
The difference is that this cycle has taken much longer to play out.
For those unfamiliar with these concepts, let me explain.
Let's say you're a market maker.
Every time you want to buy, you need someone willing to sell. If nobody wants to sell at the current price, the price moves higher until sellers appear.
But that's not what you want.
You don't want to buy high. You want to buy low.
So the first step is creating fear.
You make people believe the market is dead. You make them chase other opportunities that appear stronger in the short term. You make them question the positions they accumulated near the bottom.
That's the easy part.
And we've seen exactly that over the last couple of months, with crypto massively underperforming equities.
This is something I'll cover in an upcoming thread on liquidity rotation, so stay tuned for that.
The harder part is engineering liquidity.
In other words, creating an artificial counterparty.
Because if some participants still refuse to sell, you need a mechanism that forces them to sell.
That's where liquidation cascades and untapped lows come into play.
Whenever a series of untapped lows develops, a large amount of liquidity begins to accumulate underneath them, as many traders place their stop-losses below the nearest swing low.
The more untapped lows there are, the larger the pool of downside liquidity becomes.
And a stop-loss from a long position is ultimately a forced sell order.
Those forced sell orders become the liquidity that larger participants can absorb.
In anticipation of bearish headlines, which repeatedly emerge around Trump's announcements, market makers build these liquidity pools because they provide the fuel needed for accumulation.
This is why I see a very strong correlation between the current environment and what happened last year before Bitcoin went on to make new all-time highs.
So because of this, I remain bullish on $BTC at these levels and because of this, I have started to re-accumulate $BTC.
One of the strongest confluences for $BTC right now is the correlation between the price action and Spot Volume.
Over the last couple of weeks, every major downside wick that marked a local bottom has aligned with a spike in Spot Volume.
That signals accumulation from large players.
Not distribution.
While retail is capitulating, whales and institutional investors are absorbing the sell pressure.
This is how high-timeframe bottoms begin to form before major reversals to the upside.
Either buy in the high-timeframe accumulation phase or get left behind.
Every breakout out of these long-ranges will be extremely aggressive to flush overconfident bears.
There will be no second chance.


![ChifoiCristian's tweet photo. Bitcoin bottoming process [2]
Every bottom in the past was a deviation, and after the deviation happened:
1. Price picked up rapidly above the deviation line
2. Check back
3. Expansion rapidly after that
Caveats:
1. 2014 bear market: deviation lasted almost a year; but the 2012-2013 expansion was +53.000% -> longest bear market
2. 2018 bear market: hard deviation lasted 6 months; expansion before was 12.000%; price pick up was harder (+330%); breakdown after checkback, but black swan (closed above on the Monthly)
3. 2022 bear market: light deviation (light expansion in the past); price picked up 98%; fastest expansion after (ATH before halving)
2026:
I think this is the deviation, or we form another flagging structure here, and the deviation becomes 51k-ish
1. Price will pick up very fast afterwards
2. We should have a slowdown and check back - every trader will look for continuation to the downside, same exact as 2023 wanting new lows (or black swans like 2020)
3. Faster expansion than 2024 - I think new highs are due before summer 2027 ends
Will update in the future.
See the full video update, also checking alts charts, here:
https://t.co/qNnF7NiInt
You have a 7-day free trial.
Buckle up.](https://pbs.twimg.com/media/HMr_iFkaMAAaMKw.jpg)








![ChifoiCristian's tweet photo. Bitcoin bottoming process [2]
Every bottom in the past was a deviation, and after the deviation happened:
1. Price picked up rapidly above the deviation line
2. Check back
3. Expansion rapidly after that
Caveats:
1. 2014 bear market: deviation lasted almost a year; but the 2012-2013 expansion was +53.000% -> longest bear market
2. 2018 bear market: hard deviation lasted 6 months; expansion before was 12.000%; price pick up was harder (+330%); breakdown after checkback, but black swan (closed above on the Monthly)
3. 2022 bear market: light deviation (light expansion in the past); price picked up 98%; fastest expansion after (ATH before halving)
2026:
I think this is the deviation, or we form another flagging structure here, and the deviation becomes 51k-ish
1. Price will pick up very fast afterwards
2. We should have a slowdown and check back - every trader will look for continuation to the downside, same exact as 2023 wanting new lows (or black swans like 2020)
3. Faster expansion than 2024 - I think new highs are due before summer 2027 ends
Will update in the future.
See the full video update, also checking alts charts, here:
https://t.co/qNnF7NiInt
You have a 7-day free trial.
Buckle up.](https://pbs.twimg.com/media/HMr_iFna4AAFEoM.jpg)