$BTC For bull's 👀 only:
Small sample size but still noteworthy.
Notice the last two oversold RSI divergences (in orange) formed bottoms.
The last two recent drops (in blue) had no RSI divergences...
UNTIL NOW...
Is this the one?
Just something to ponder.
$MSTR is valued at just 57% of the Bitcoin on its balance sheet.
That's near the lows seen during the brutal 2022 bear market.
By this metric, the stock looks incredibly cheap.
$MSTR has finally caught up to Bitcoin.
Both are backtesting the top of multi-year reaccumulation ranges with bullish RSI divergences developing.
Sentiment is overwhelmingly bearish.
I think this will be remembered as one of the best buying opportunities of the cycle.
The most objective way to view any asset irrespective of narrative is to look at its technicals.
While everyone on X is telling you that Strategy $MSTR is a "ponzi" (it's not), all I see is a macro backtest of the 0.786 fib at $80 which almost hit today and strength indicators bottoming on the HTF.
Look at where we are today, the narratives attacking the business model, Bitcoin bitcoin:native sentiment, personal attacks on Saylor, and where MSTR price is relative to support.
Not only are they well-capitalized and can meet their obligations but they have almost 7x more Bitcoin bitcoin:native than they did in 2022.
At the bottom of the bear market in 2022, all the narratives were the same. Price took 262 days to find a bottom. I'm sure no one who stayed invested complained in what happened over the next year
Investing is a blood sport. Not everyone is cut out for it. You can't have the massive volatility to the upside without resetting the sentiment
One of the strongest confluences for $BTC right now is the correlation between the price action and Spot Volume.
Over the last couple of weeks, every major downside wick that marked a local bottom has aligned with a spike in Spot Volume.
That signals accumulation from large players.
Not distribution.
While retail is capitulating, whales and institutional investors are absorbing the sell pressure.
This is how high-timeframe bottoms begin to form before major reversals to the upside.
$BTC harmonic oscillator at -100.
55% below fair value of $134,303.. the deepest discount of the cycle 𝙨𝙤 𝙛𝙖𝙧.
i've flagged this in feb, march, and now.. same signal, still -100.
this isn't a trade. it's a 3-4 year horizon DCA entry.
It's time for an in-depth update on $BTC.
This will be one of the MOST IMPORTANT threads you're going to read right now on Bitcoin, so make sure you check it out.
In my previous update, I highlighted that the most likely outcome was a final corrective Wave C on the low-timeframes before an eventual reversal to the upside.
This is exactly what we're currently seeing, as Bitcoin has just formed new lows today, dropping as low as $58K.
Because of this, I'm now starting to become more bullish on the low-timeframes.
This is the first time in weeks that I've taken a more decisive bullish stance, as I've started scaling out of the hedges I took following the breakdown below the high-timeframe support range aligning with the early-April 2025 lows at $77K.
I've started rotating that capital back into my spot holdings and re-accumulating in order to position for a reversal to the upside.
On the high-timeframes, this is something I've done multiple times. I hedge when key technical breakdowns take place, then scale out of those hedges once the price reaches major high-timeframe support ranges, and then repeat the process again.
It wasn't perfect, and I wasn't trying to predict the exact bottom. The goal was simply to protect my capital, mitigate downside risk, and gradually increase my spot position over time to position myself for an eventual reversal to the upside on the high-timeframes.
Now it's time to objectively discuss what comes next.
In my view, further downside remains the most likely outcome on the low-timeframes towards the high-timeframe support range at $55K-$56K, where I believe a more durable bottoming formation is likely to develop and where the corrective Wave C I've covered in prior updates is likely to complete.
"But Luca, if you expect more downside, why are you buying now?"
Because I don't care about perfectly timing the bottom.
I care about accumulating assets that I believe will be worth significantly more in the coming months and years.
I believe Bitcoin will be trading above current levels 12 months from now, and with a major high-timeframe support range sitting near the current price, I believe the risk-reward setup is becoming really good, with relatively limited downside compared to the potential upside.
But let's move away from the "bullish hopium" some of you may call, and let's look at the objective data.
Looking at liquidation data, we can see that on an 8% move either higher or lower, there are currently roughly five times more shorts than longs.
That tells us that most of the long liquidation has already took place and that the market is now heavily positioned on the bearish side.
But anyone can look at a liquidation chart.
The real alpha is in the Velo data.
That's where a very interesting setup is developing.
First, while the price has been falling, Open Interest has continued moving higher.
For those unfamiliar, Open Interest measures the total amount of open perpetual positions, so both longs and shorts.
At first glance, you could argue that these are simply desperate bulls doubling down on their longs to avoid liquidations.
But that's where Funding Rates become important, as they measure the ratio between longs and shorts.
Funding Rates have continued moving lower while Open Interest has increased.
That tells us that these are not aggressive longs entering the market.
They're aggressive shorts.
Bears are doubling down on their positions and betting on a continuation lower.
And while they may be right in the short term, I believe they will be very wrong on the mid-term.
But that's not even the most interesting part.
The most important confluence is coming from Spot Volume.
When we look at the price action over the last couple of days, every major downside wick that marked a local bottom also aligned with a spike in Spot Volume.
And that means buying pressure.
The type of buying pressure that only larger players can create on the low-timeframes.
While retail investors have been capitulating over the last couple of months, whales and institutional investors appear to be absorbing that sell pressure.
And this is where my broader thesis comes into play.
I believe that the series of rising wedges and untapped lows that have repeatedly developed on the low-timeframes have been part of a process designed to create an artificial counterparty.
This is a thesis I've discussed before.
In fact, I covered this exact same concept back in April of last year when Bitcoin formed a major bottom.
That thesis helped me identify the reversal and begin scaling out of hedges while rotating capital back into spot holdings, the same thing I'm doing right now.
This is the thread I shared at the time:
https://t.co/XQbySirHXJ
Today, we're seeing a very similar structure.
A series of untapped lows developing on the low-timeframes, followed by liquidation cascades that liquidate impatient investors and specifically retail traders.
The difference is that this cycle has taken much longer to play out.
For those unfamiliar with these concepts, let me explain.
Let's say you're a market maker.
Every time you want to buy, you need someone willing to sell. If nobody wants to sell at the current price, the price moves higher until sellers appear.
But that's not what you want.
You don't want to buy high. You want to buy low.
So the first step is creating fear.
You make people believe the market is dead. You make them chase other opportunities that appear stronger in the short term. You make them question the positions they accumulated near the bottom.
That's the easy part.
And we've seen exactly that over the last couple of months, with crypto massively underperforming equities.
This is something I'll cover in an upcoming thread on liquidity rotation, so stay tuned for that.
The harder part is engineering liquidity.
In other words, creating an artificial counterparty.
Because if some participants still refuse to sell, you need a mechanism that forces them to sell.
That's where liquidation cascades and untapped lows come into play.
Whenever a series of untapped lows develops, a large amount of liquidity begins to accumulate underneath them, as many traders place their stop-losses below the nearest swing low.
The more untapped lows there are, the larger the pool of downside liquidity becomes.
And a stop-loss from a long position is ultimately a forced sell order.
Those forced sell orders become the liquidity that larger participants can absorb.
In anticipation of bearish headlines, which repeatedly emerge around Trump's announcements, market makers build these liquidity pools because they provide the fuel needed for accumulation.
This is why I see a very strong correlation between the current environment and what happened last year before Bitcoin went on to make new all-time highs.
So because of this, I remain bullish on $BTC at these levels and because of this, I have started to re-accumulate $BTC.
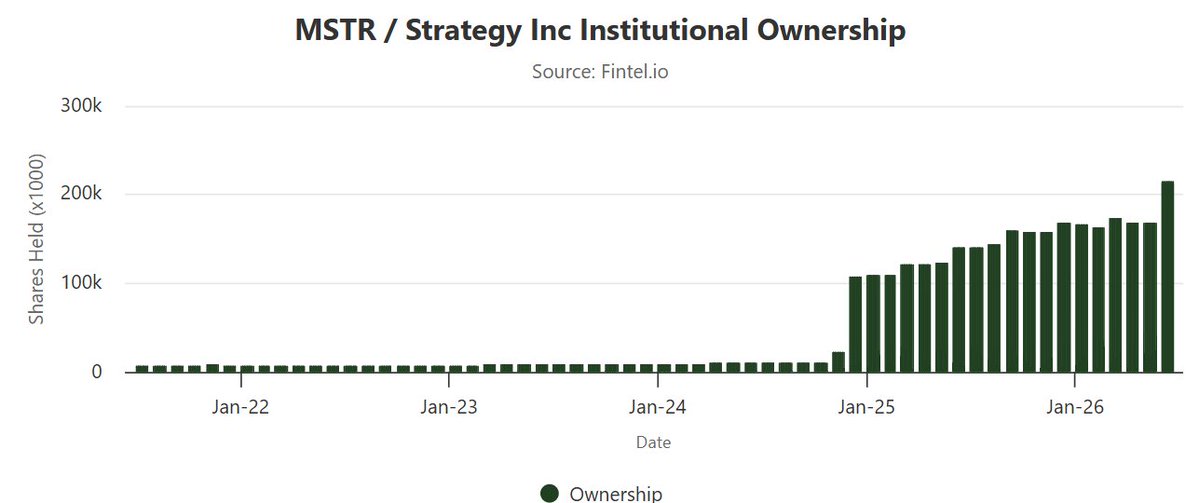
While you continue to sell your shares of Strategy $MSTR and poke fun at Saylor's "ponzi scheme" institutional investors have bought shares at the fastest pace ever in the last few months
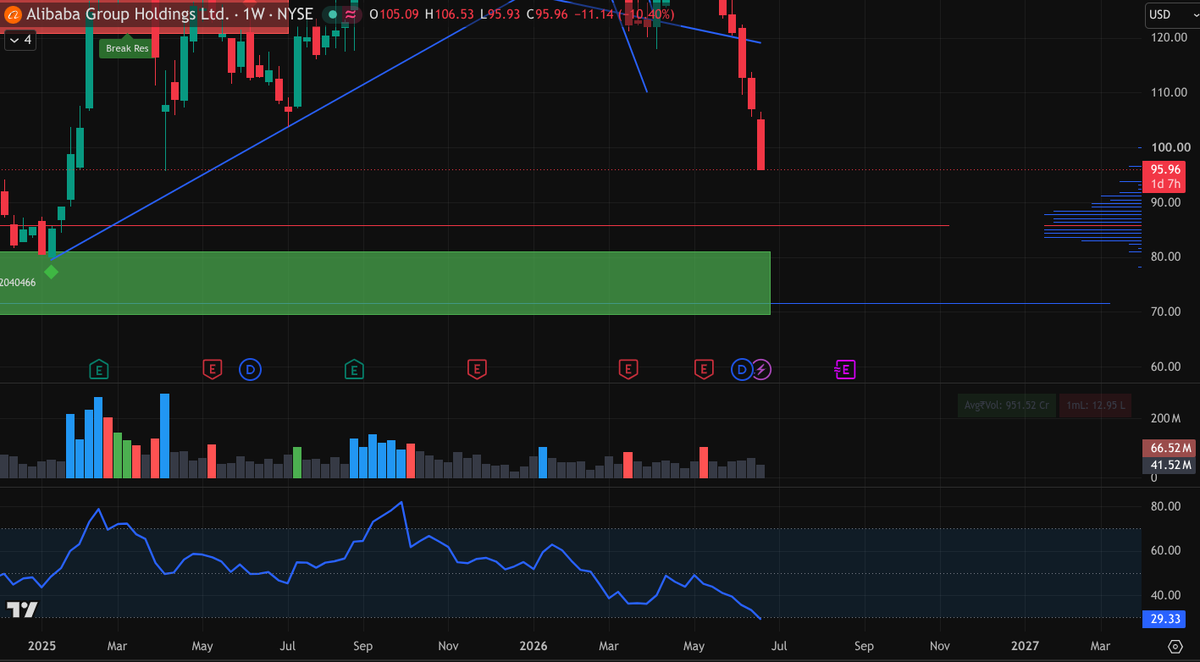
Alibaba’s management is loading up on their own stock again! 🚀
Two straight days of buybacks on the NYSE. While others panic, the company is taking advantage of cheap shares. Follow the smart money. $BABA
https://t.co/ydi0QqwTxK
Nobody wants to touch Chinese stocks right now.
Perfect.
The best opportunities appear when sentiment is dead.
$BABA — As already expected back in March, I believe we could see prices below $100 first. After that, I expect a major trend reversal toward $300+.
$BIDU — The “Google of China” also looks close to a trend reversal. My reversal zone is between $100 and $90, with a target of $245+.
$NIO — As long as the red line at $4.38 holds, my next target is around $10. Over the long term, $NIO could easily 6x from current levels.
$XPEV — My favorite Chinese stock. My next target is at least $44, and as long as the stock does not break below $6.55, the broader structure remains intact.
China is not risk-free.
But hated markets can create the most violent reversals.
Are Chinese stocks the next major comeback trade?