The chart below shows the history of bubbles and overshoots. During most bubbles, asset prices rose about 10-fold in real (inflation-adjusted) terms before a bear market began (the dashed horizontal line).
In real terms, the Nasdaq 100 Index has already risen tenfold, while global semiconductor stocks have gained more than tenfold.
This alone is not sufficient to be bearish. However, in combination with the gigantic AI IPOs, the odds are high that we are in the late innings of AI-frenzy (see this post on IPOs marking top https://t.co/nt0CPx21dg).
Soaring demand for leveraged equity exposure is straining dealer balance sheets, pushing equity financing costs sharply higher and threatening to spill over into short-term funding markets.
Soaring US Equity Funding Costs Risk Spilling Over to Repo Rates
https://t.co/xOBw1Gfkbh
We have officially moved into uncharted territory. Margin debt and geared funds relative to M2 money supply reached a new record in May, surpassing the previous high set at the peak of the dot-com bubble. Never before have investors devoted such a large share of available liquidity to leveraged speculation.
One way to frame today's market: you can now earn a higher real yield from 30-year TIPS than the S&P 500's nominal cyclically adjusted earnings yield. Whether you consider TIPS truly risk-free or not, the opportunity cost of paying extreme multiples for equities has changed. Money goes where it is treated best.
'Tech firms are raising ever more cash from the markets. But the same egregious valuation conditions that led companies to issue large amounts of their own stock, also led Berkshire Hathaway to increase its cash holdings 1-2 years prior' - Simon White
https://t.co/Sti9GEIYro
Companies are tapping the stock market rather than buying back shares because that’s what YOU are rewarding.
Record underperformance for buyback-heavy vs capex-heavy stocks in 2026.
And companies on buyback binges are lagging no-buyback stocks by the most since 2008.
'Demand for single stock optionality has concentrated primarily in calls, with the equity put/call ratio hitting their lowest outside of 2021 “meme stock” and late 90s Tech Bubble extremes. A record 35% of stocks in the S&P top 100 now trade with inverted 3-month call skew...retail optimism in Tech is reaching a near record, with bullish trades making up almost two-thirds of all retail opening options activity in the mega-cap Tech stocks' https://t.co/Xes5o0mH1A
Margin debt (plus geared funds) as a percentage of M2 hit a new cycle high in April.
Then came May's semiconductor mania.
There's a decent chance this ratio has now eclipsed the dot-com record, meaning investors are committing a larger share of available liquidity to leveraged market exposure than ever before.
The Taylor Rule is a widely used framework that estimates where the Fed Funds rate should be based on inflation and economic slack.
Thirty variations of the Taylor Rule all point in the same direction: Fed policy remains accommodative. The current Fed Funds midpoint is roughly 180 basis points below the average prescribed rate. Even the most lenient model calls for a Fed Funds rate 75 basis points higher than today.
Margin debt growth hit 50% year-over-year in April, before May's semiconductor-fueled melt-up. Speculative appetites don't run that hot very often. Over the last century, this is only the 15th episode in which margin debt growth exceeded 50%.
The longer-term trend is just as notable. 3-year annualized margin debt growth is now the highest since the summer of 2007.
Periods of exceptionally rapid margin debt growth have historically accompanied some of the market's biggest advances – and some of its most important peaks.
The Shiller CAPE Ratio appears likely to close May above 40x for the first time since September 1999. (CAPE smooths earnings over a full business cycle to gauge valuation.) Just a little more enthusiasm from the retail crowd and we may be revisiting a record many thought would stand for generations.
'Retail options traders have traded roughly ~2.8x their average daily semiconductor volume this month, nearly ~25% above the prior record set in June 2024, during NVDA’s stock split and run to surpass MSFT as the world’s most valuable company.' - Scott Rubner
https://t.co/h4BCuioZga
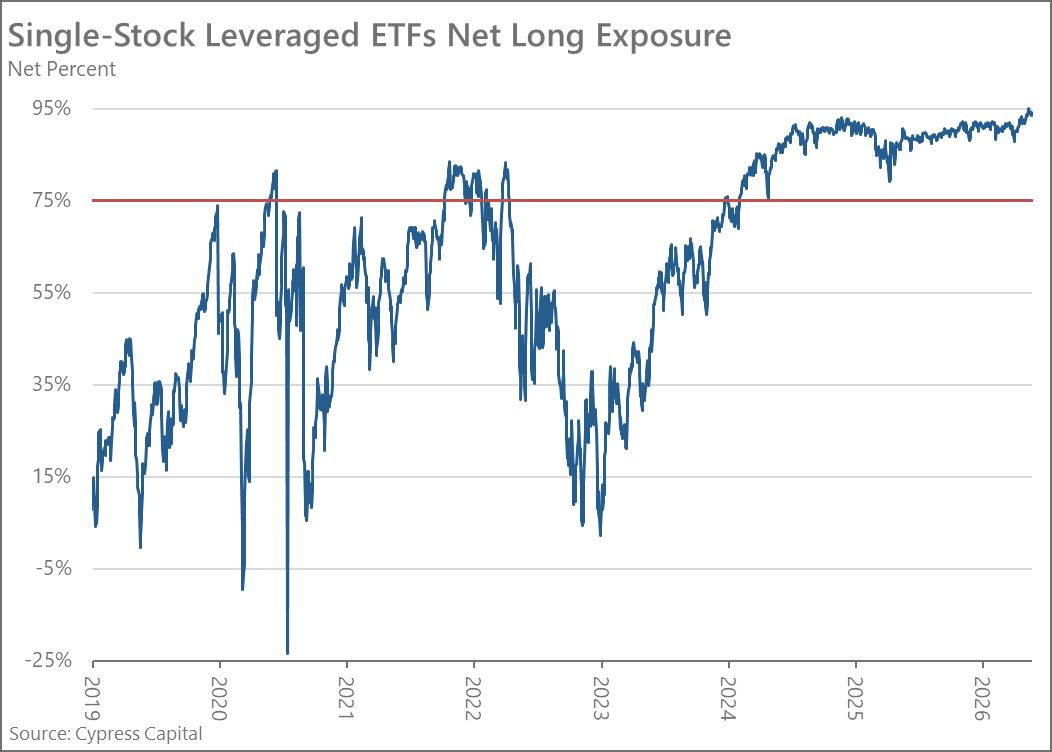
Single-stock leveraged ETFs now account for nearly 25% of leveraged ETF assets – up from almost nothing just a few years ago.
And if these products were remotely about hedging, net exposure probably wouldn’t be at a record 95% long. Speculation is getting narrower, faster, and more concentrated.
"It has seemed inevitable for some time, but commercial electricity demand in the US is finally surpassing residential, largely driven by data centers and miners. Given the commercial's growing importance to utilities, it should be little surprise that residential customers' complaints are increasingly falling on deaf ears. " - Paul Kedrosky
https://t.co/LPb26yF4VZ
Stock market values tower over the economy...Total Market Cap (incl FDI) to GDP hit 3x.
The higher valuations climb relative to GDP, the more the economy depends on elevated asset prices. A normal cyclical bear market could erase wealth equivalent to an entire year of US economic output.
Bond vigilantes got soft after decades of disinflation. The longer inflation refuses to normalize, the harder it becomes for bond markets to pretend otherwise. Inflation may be reminding them what they’re supposed to do.