$SPX: Bearish conviction in price action, the 5DMA has been breached and the price is overbought considering the RSI. Bearish continuation is likely, $AVGO is setting a stop to the Semiconductors train. $VIX bouncy.
The latest market update is out: Cracks Underneath.
$PLTR neared the $165.7 bullish target. Monday's move was so fast it printed an indecisive candle outside the upper Bollinger Band. Now back in the range, price must hold the critical $148 level to sustain short-term momentum. The diagonal breakout is still constructive.
$SPX: Slow moves keeping the price moving up steadily. Same as yesterday, $7,620 acted as a resistance zone. The close was better than yesterday, but the resistance remains the same; bulls want a breakout and bears want a definite rejection. Greed is at 57, breadth is still weak.
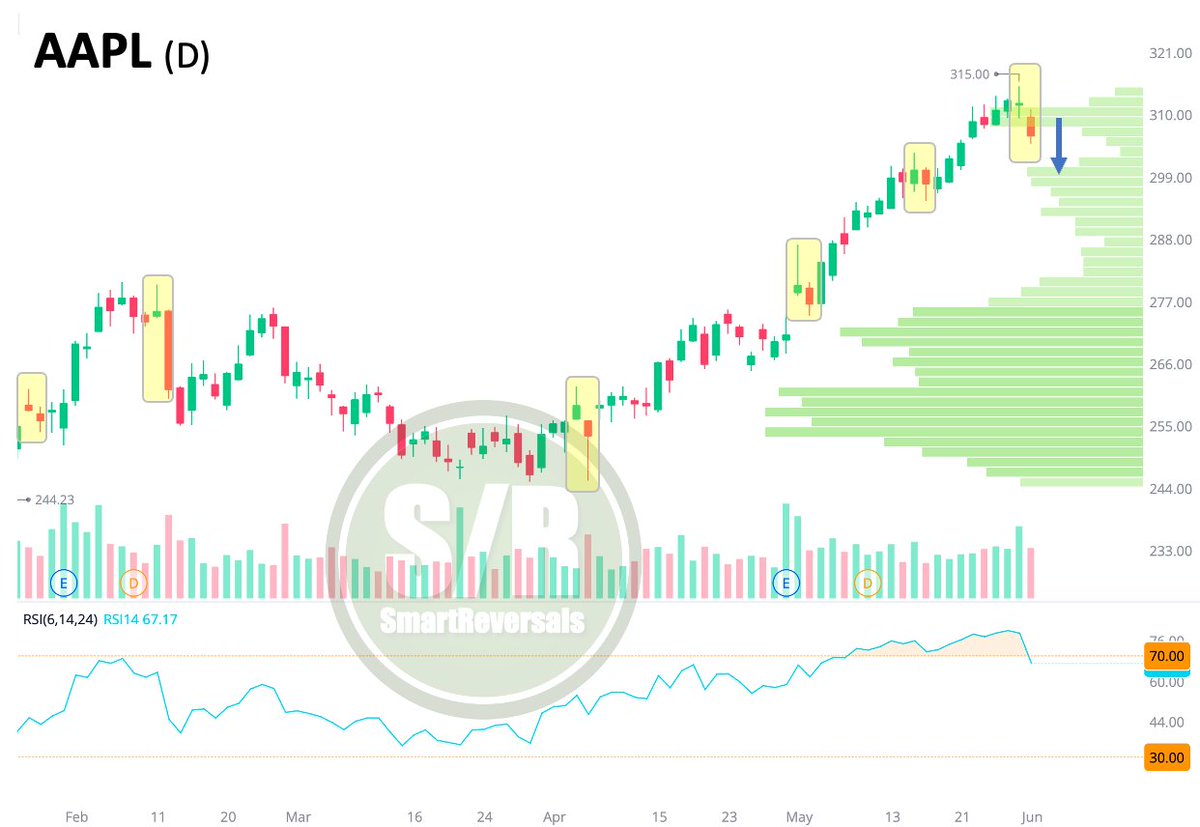
$AAPL: Shooting star candles in Apple have a high accuracy rate as near-term bearish signals. Today, we find out if this drop is short-lived or sustained. Different this time: an overbought RSI and a volume gap down to $299.
As we head into June with the S&P 500 at the highest level it has ever traded at, just remember this is the only month to never see the ultimate peak for the year.
$IGV: The software industry is fueling the market with major moves. While the ETF is reaching overbought conditions on the bands and RSI, a rally still has room to run, given how many individual names are bouncing from oversold territory.
Daily levels avail for founding members.
$NOW: The rally reclaimed the 20-week moving average for the first time in 9 months. While the open gap at 110 might set some pressure, the breakout was strong; any eventual consolidation could be viewed as a buying opportunity.
Full level details are posted in the premium chat.
$QQQ: Indecisive daily price action, an overbought RSI divergence, and a gap sitting below at $722. With no major geopolitical news fueling the tape this weekend, a consolidation or a pullback is highly possible here. The volume shelf is a strong demand zone. $NDX
$SMH: Since semiconductors have driven most of the recent rally, printing a weekly indecisive candle with a gap below is a reason to be careful. The overbought RSI points to the same thing.
To fill the gap, SMH would have to fall -5%.
$QQQ $SPY
PEOPLE ALWAYS COMPLAIN ABOUT ELON’S $1T NET WORTH
BUT THEY ALWAYS IGNORE THE $ 3-4 TRILLION HE CREATED FOR INVESTORS AND EMPLOYEES ALONG THE WAY
NUMBERS DONT LIE. NARRATIVES DO.
Are we heading into a 10th consecutive green week, or is a healthy consolidation on deck? -> I break down 4 market indicators to monitor in the Weekly Compass, a new proprietary feature is introduced. High-probability trades included.👇 $SPX $AAPL $IWM $BTC $MSFT $AMD and more.
solana:J3NKxxXZcnNiMjKw9hYb2K4LUxgwB6t1FtPtQVsv3KFr Just connecting the dots here because it looks pretty. That's all.
Not sure which way this goes next week and for June.
$MSFT was posted as a high probability setup last week, and the $441 target was surpassed for a 7.5% weekly move 🎯. Price action shows conviction and even after a consolidation given the Bollinger bands, the context suggests continuation.
Any software stock to chart?
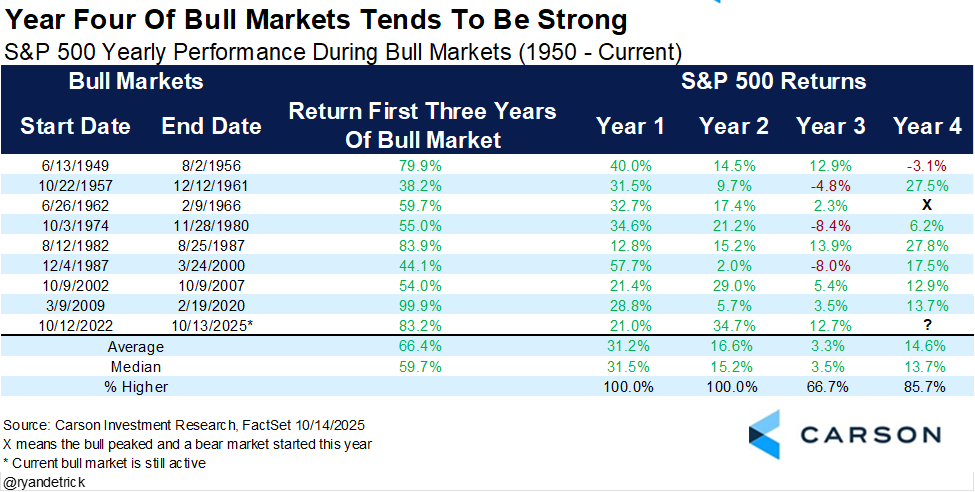
As we noted back in October, once a bull market gets past it's third birthday, that next year (year four) tends to be quite strong and bull markets rarely ever end during year four of a bull market.
So far, year four is year fouring.
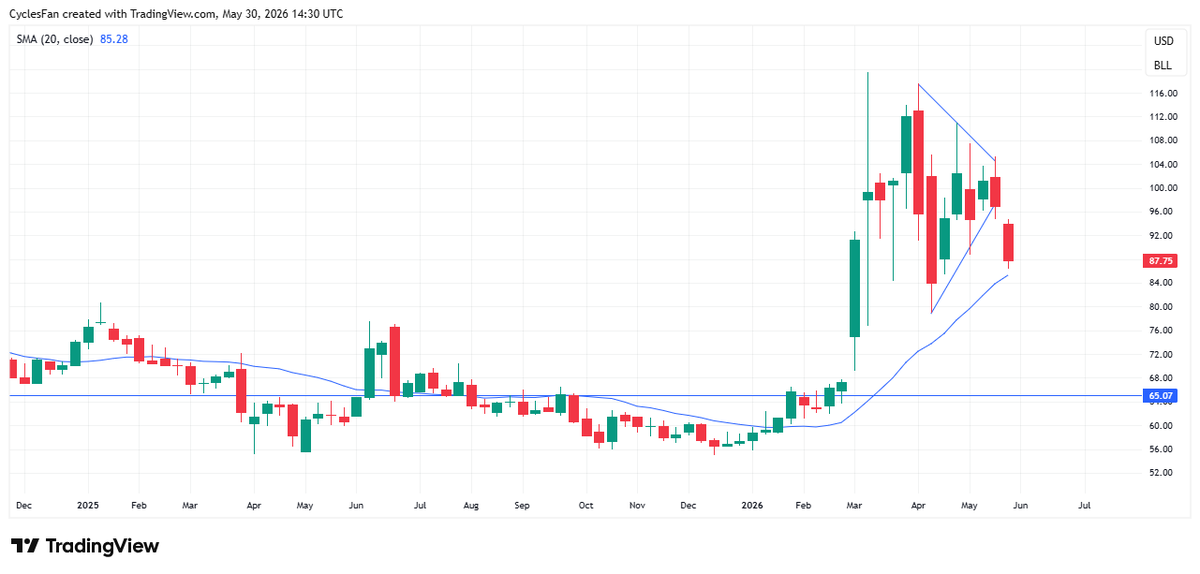
$USOIL - The target of the triangle breakdown is $65 but the price of crude oil is still above the 20 week MA. We have to see a weekly close below the 20 week MA in order to confirm that it is headed to 65.