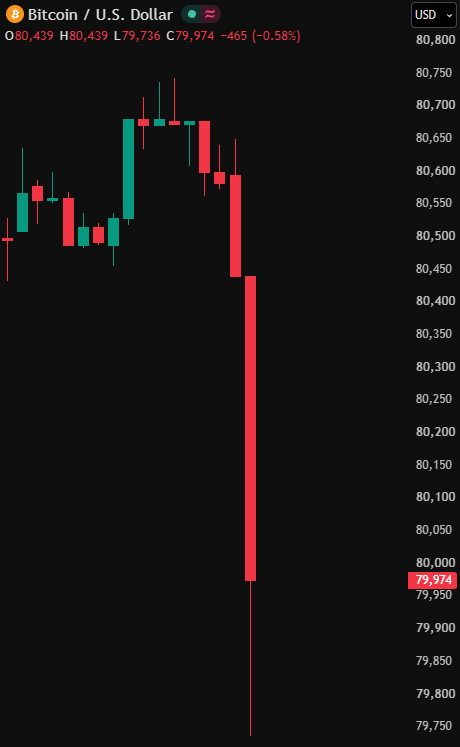
🚨ALERT: Bitcoin dips below $80,000 for the first time since October 15.
$219 MILLION in crypto longs wiped out in the past hour.
The biggest single liquidation in the past 24 hours was an $11.84 MILLION $BTC long, per CoinGlass.
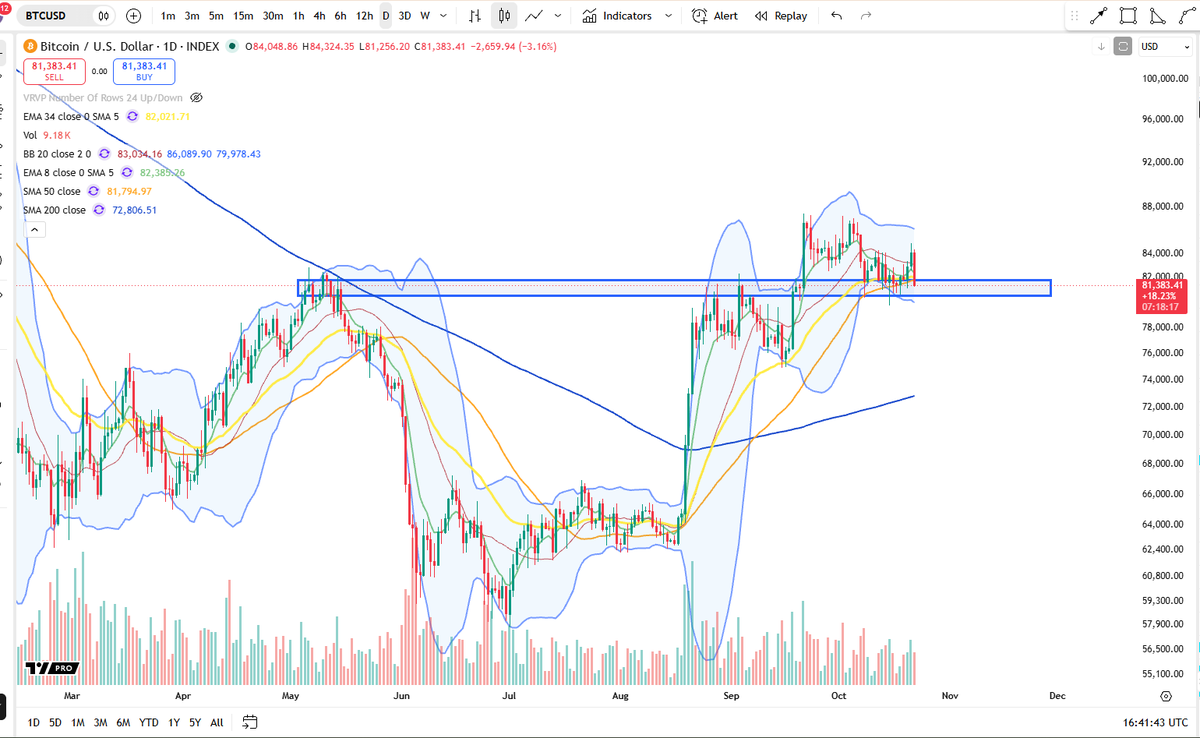
#Bitcoin Daily Key Zones
The first bullish FVG has been lost.
BTC is now working through the second one around $77K–$81K.
If this zone holds, a reaction could follow.
Lose it, and the next major FVG sits around $74K–$76K.
$BTC Has meanwhile moved back to its 2 year moving average price after deviating below it for some time.
In my previous tweet I mentioned how Bitcoin tends to. historically trade at good high timeframe value when it is below that level. The big question is usually how long it remains below that area. In this case it didn't take a long time because since then, price moved up from $63K to $87K at its recent high in just 3 months.
Good reason why I always like to keep looking at these high timeframe "indicators" to determine when BTC is at historically good value levels.
$BTC Back to the local range low where it has traded at for a lot of the past two weeks.
Lost both the 4H 200MA/EMA as neither could hold on the way down.
Crypto in itself still showing a lot of relative strength to stocks lately. Whether that's actual strength or just lagging we will see soon enough.
$80K is the level to hold for the bulls. $85K & $87K are the levels to watch above.
Don't get chopped up in the middle.
$ETH Remains stuck in its $2350-$2550 range.
Easiest is to just put alerts on both of these levels and then reassess from there.
In between will just me more chop like we've been seeing.
Bitcoin getting a daily close below the 50D SMA likely sends it to the bull market support band.
Note that ETH, MSTR, NDQ, TOTAL2, TOTAL3, etc. are already at the bull market support band.
$ETH Very indecisive against $BTC. Now sitting right at its Daily 200MA which it has traded at for some time.
ETH's relative weakness has also made it so most alts underperformed BTC during this sideways chop.
Always one of the main indicators of altcoin strength relative to BTC which is why it is good to watch.
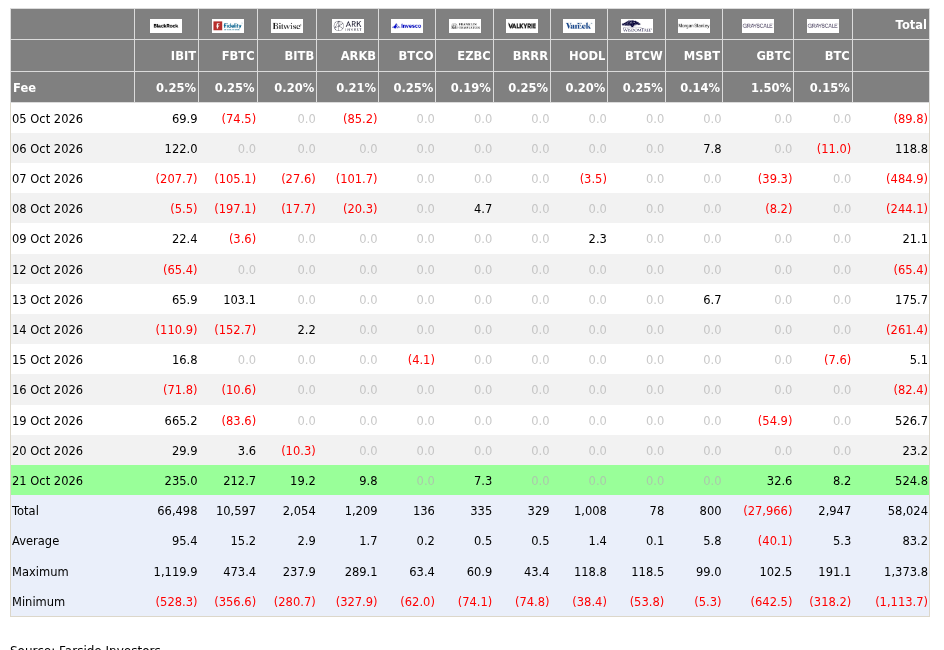
#Bitcoin sitting right on the ETF cost basis around $81k. That's the average price ETF buyers paid, so a lot of them are back near breakeven, and breakeven is where tired holders like to sell.
Altcoin price action the next couple days could be a clue for what $BTC will do.
$ETH Solid reaction after the range sweep.
Bulls need to retake and hold above $2550 and then we can start preparing for $3K+ for the first time in a while.
Range for now but BTC looks like it wants higher too.
ethereum:native - Update
We are still mid range, but built up a lot of liquidity lower on those pumps. Many are to keen to over leverage long and short on each pump and dump.
bitcoin:native is testing the ETF cost basis around $81K again.
The same level capped the May rally before a deep drop, and caught last week's sweep from just below.
A convincing close below it would put mid $70K levels back into play.
$BTC FOMC coming up, end/start of the month and earnings season. All in the next 1-2 weeks.
All these usually make for a choppy market environment. Afterwards I think price action should be cleaner again.
Liquidity sits at the local highs and lows. Big cluster below $80K and then above $87K.
Those are also the levels I am waiting for at this point. Not interested in trading anything in between really unless it's a super solid setup.
a16z is dropping "crypto" from the name of its flagship crypto fund
82 crypto protocols have already shut down this year
That's what happens when dumping on retail is your whole business plan
Bitcoin's marketing team could not be reached for comment