For decades, biology textbooks have enshrined a simple rule: DNA is made by copying a template. After one enzyme unzips a DNA double helix into separate strands, another called a polymerase builds a complementary sequence, base by base, for each strand. Presto: two copies of the original DNA.
But new research into how bacteria defend themselves from viruses now shows this synthesis rule isn’t absolute.
Now, a team describes a bacterial enzyme that synthesizes DNA without a nucleic acid template, using its own structure as a guide.
Learn more: https://t.co/TeUWvyO0OD @NewsfromScience
Is #AI turning grant evaluation into a lottery? 🎲
The 2025 generative AI improvement coincides with ~20% of proposals scoring >95% in EU #MSCA call.
We’ve reached "excellence saturation."
Time to rethink funding?
👉 https://t.co/Y5qWh1vttF
#MetaScience#AcademicChatter
We're looking for a new #postdoc colleague to join our team at @fzpczu in Prague (Czechia). Ideally, someone with expertise in macroecological and macroevolutionary analysis to help fill our knowledge gaps in this area :)
Full call:
https://t.co/yN0GmsHsjo
#postdoccall
The same questions and data, but analysed by 100+ teams generating greatly diverging analytical decisions . See our fresh paper in BMC biology : https://t.co/dCzMeEkIZy.
I've just explored the brand-new tidyplots package in R, and it’s impressive how effortlessly it enables you to create beautiful, publication-ready plots. Designed with scientific papers in mind, tidyplots lets you build, adjust, and refine plot components gradually, all with a consistent and intuitive syntax that takes the complexity out of visualization.
✔️ Simple Syntax: Tidyplots offers user-friendly functions for creating polished visuals with minimal coding, saving you time and effort.
✔️ Consistent Style: Achieve a cohesive look across all visuals, eliminating the need for repetitive adjustments.
✔️ Flexible Customization: Easily customize colors, labels, and themes to align with your project’s goals, resulting in professional and engaging data displays.
✔️ Enhanced Data Storytelling: Built for clarity, tidyplots helps you convey insights effectively, making your data stand out.
The example visualizations shown here were created by the package author, Jan Broder Engler, and are featured on the tidyplots website: https://t.co/fgIWzxFVZI
#rstats #dataviz #tidyverse
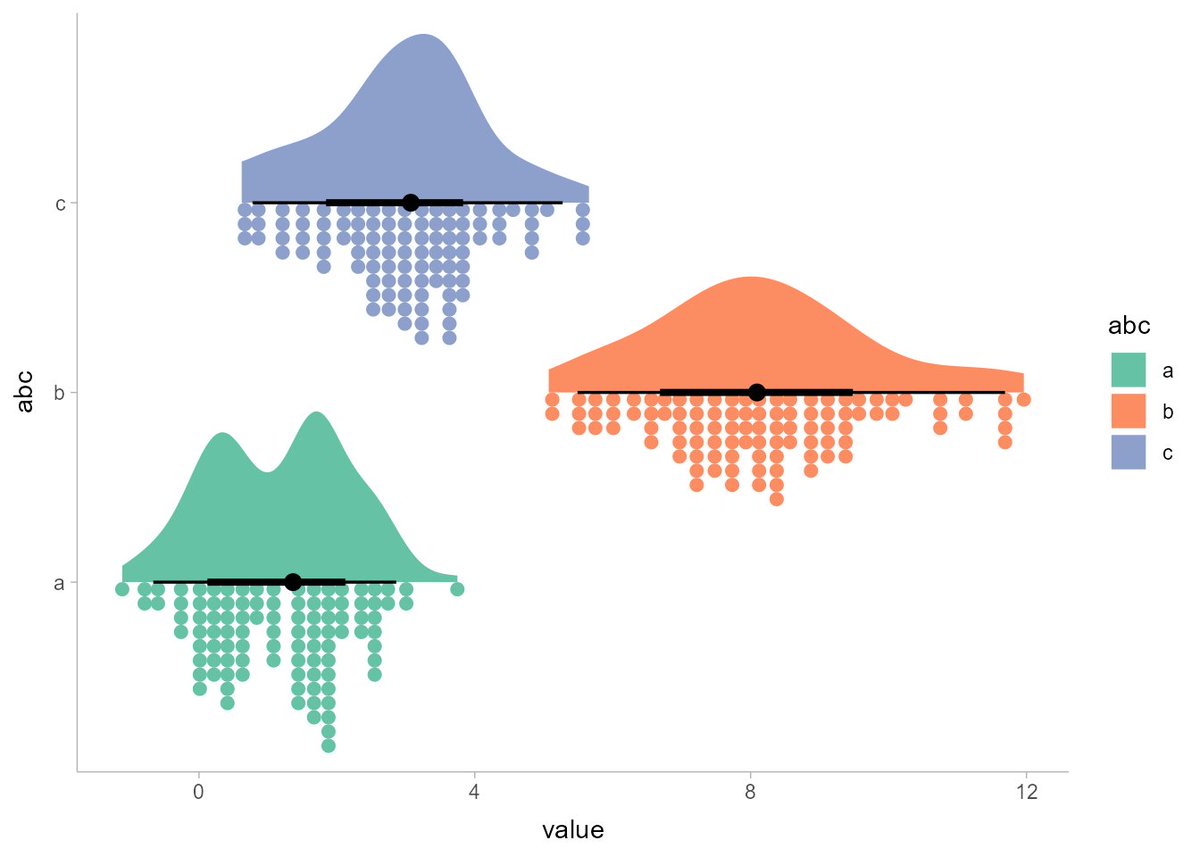
Want to show detailed distributions and intervals in a single, easy-to-read plot? The ggdist package’s geom_dotsinterval() and stat_dotsinterval() functions make it simple to create versatile dot+interval visualizations, including Wilkinson dotplots, beeswarm plots, quantile dotplots, and even composite plots like raincloud plots.
Key advantages of geom_dotsinterval() and stat_dotsinterval():
✔️ Flexible Dot-Based Visuals: Easily create various dot plots that effectively convey data density and distribution.
✔️ Enhanced Distribution Insights: Combine dot plots with interval estimates to show data uncertainty and distribution simultaneously.
✔️ Customizable Composite Plots: Mix with half-eye elements to build unique visuals like raincloud plots, ideal for richer data interpretations.
With these tools, ggdist provides a seamless way to make complex statistical insights more accessible. The attached image shows an example of a half-eye dotplot, illustrating how effectively ggdist handles layered data displays. This visualization is from the ggdist package website, demonstrating its powerful features: https://t.co/FuTG9CxGLo
Interested in mastering this and other advanced ggplot2 techniques? Join my online course, Data Visualization in R Using ggplot2 & Friends, starting November 25, 2024.
For more information, visit this link: https://t.co/ztlEzoEDWv
#coding #DataAnalytics #Rpackage
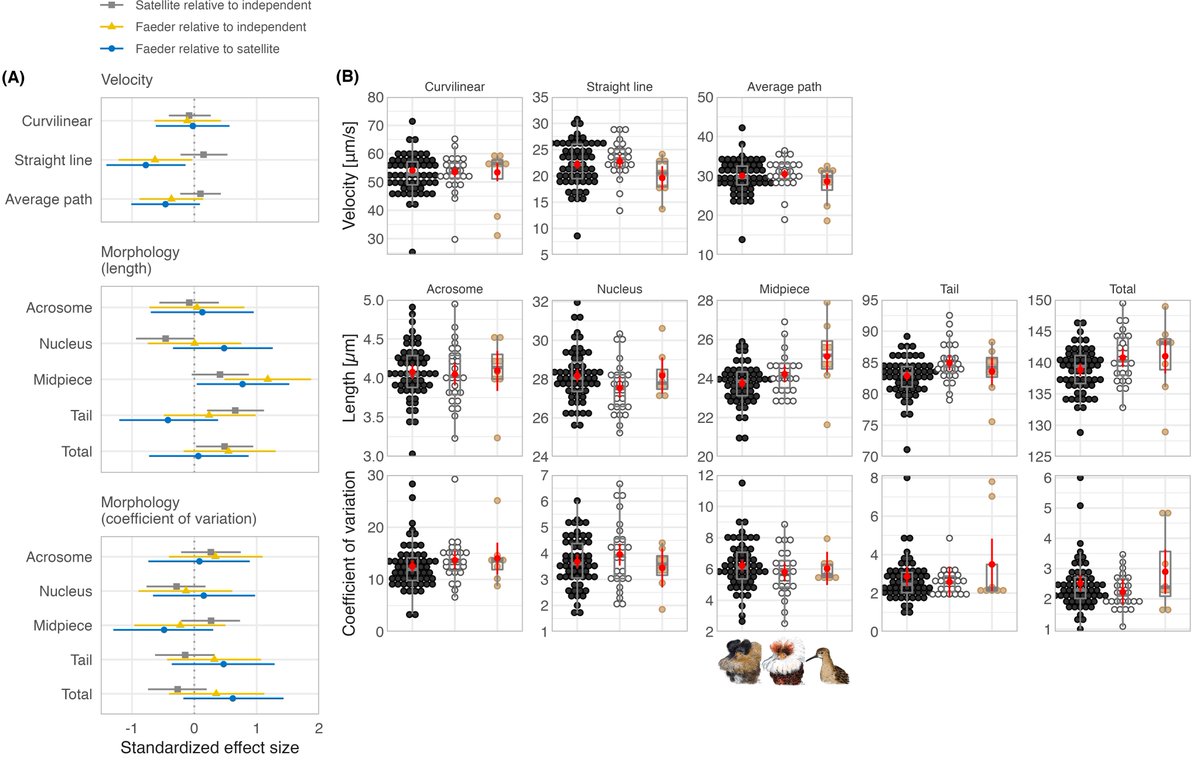
Just got accepted!🎉While #ruff sandpiper #morphs differ slightly in sperm speed and morphology, no distinct polymorphism emerged. Stay tuned for the full paper on insights into alternative mating tactics! 🔬
https://t.co/XMvoEaL0UK
#Ecology#Evolution#Ornithology@fzpczu
Just got accepted!🎉While #ruff sandpiper #morphs differ slightly in sperm speed and morphology, no distinct polymorphism emerged. Stay tuned for the full paper on insights into alternative mating tactics! 🔬
https://t.co/XMvoEaL0UK
#Ecology#Evolution#Ornithology@fzpczu
Do mammals in tropical rainforests change their activity in response to full moon🌳🌑🌓🌕🌳? The answer is yes and you can find more about it in our NEW PAPER published @RSocPublishing, led by R. Bischof and w/ contribution from many other great researchers!
The results suggest low generalizability of the empirical findings under consideration across different study designs and statistical analyses.
#ornithology#Statistics@NatureEcoEvo@FrontEcolEvol
https://t.co/KbjYwt69rU
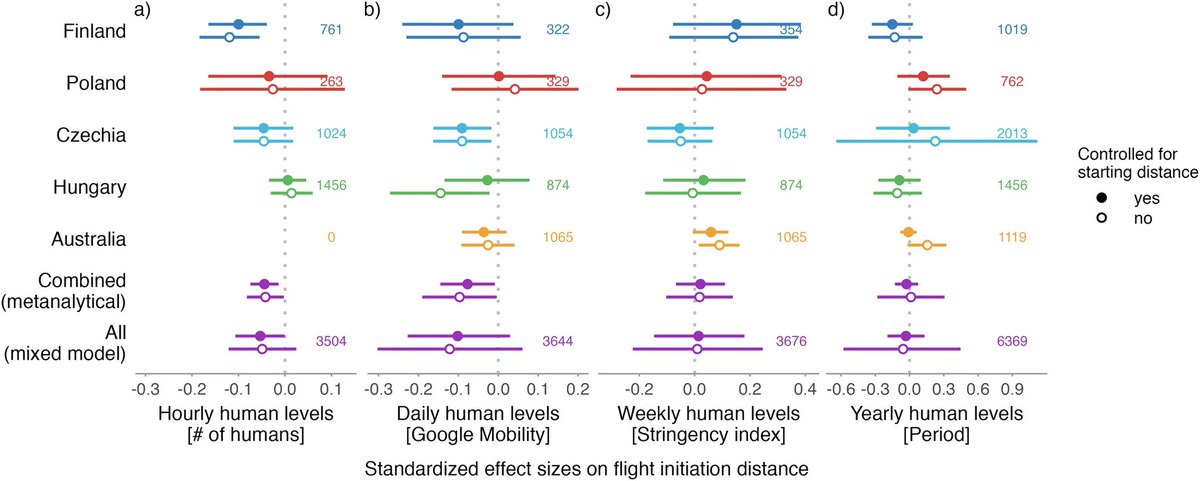
📢New Research @CommsBio 🐦
A study on urban birds' tolerance towards humans highlights their resilience to changes in human numbers, induced by COVID-19 shutdowns, across multiple temporal scales.
@birder158@MartBulla@fzpczu
https://t.co/eRkqJD3t8i
Going official with the release of something we've been cooking up for the last 3.5 years--a complete phylogeny of the world's birds! We = @snacktavish, @Avibase, and other great collaborators from @opentreeoflife and @CornellBirds. Why is this such a big deal? A few reasons.
Our paper nominated by @IBIS for the best Early Career Researcher award.
👉 support us until 10 March at https://t.co/xrSjJAahus by ticking 'Nest reliefs in a cryptically-incubating shorebird are quick, but vocal'.
#ornithology#wader#shorebirds@fzpczu@MPIforBI