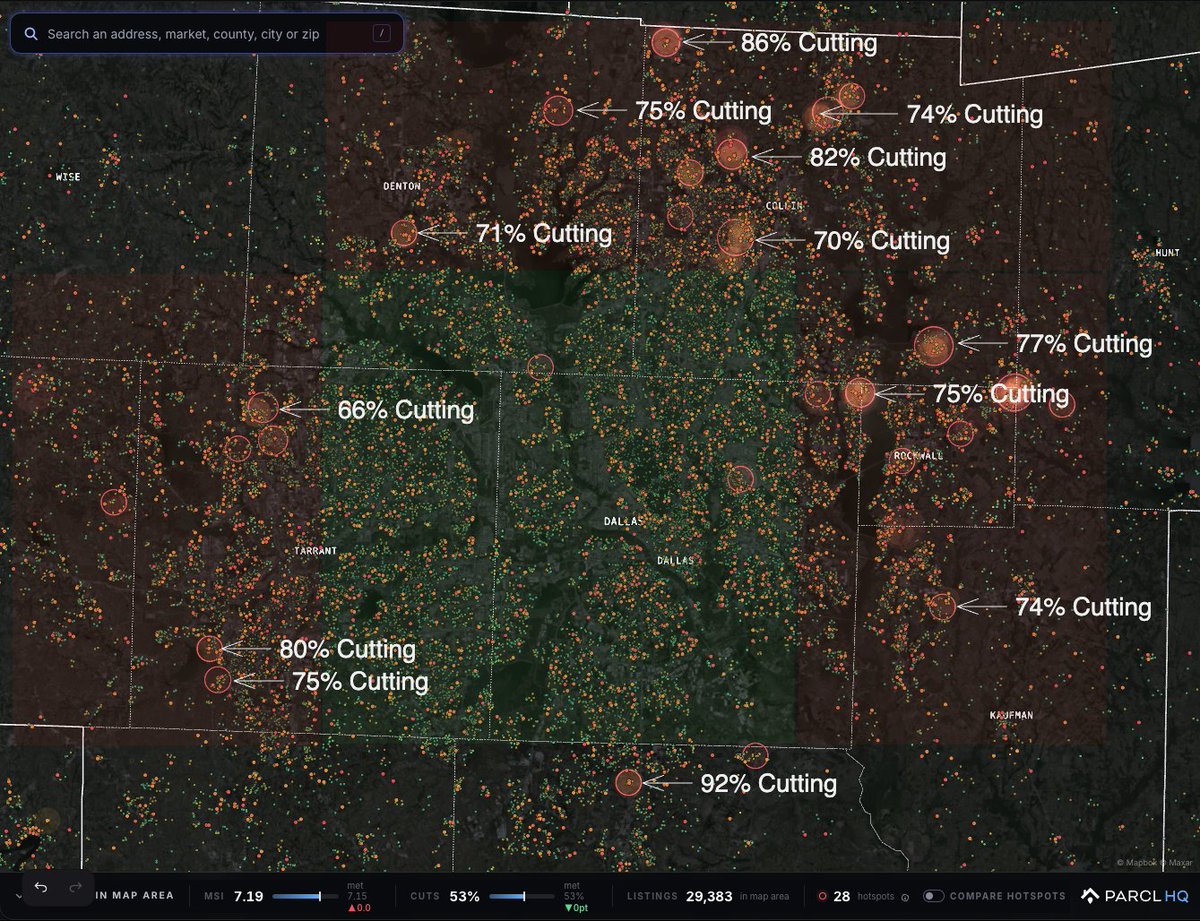
The walls are closing in on the central part of Dallas, with dozens of locations on the perimeter having 70%+ of all homes for sale undergoing price cuts.
DFW metro currently has a staggering 52.9% of all homes for sale undergoing price cuts.
In Denton, Collin and Kaufman counties, this is even higher above 56%.
There is currently a battle in DFW between existing homes for sale and new construction. This is most pronounced in the outer perimeter, but the walls are closing in.
Lets dig in.
A humble attempt to est. the infra required to serve 100M DAU @Muse
Rough conclusion is:
1 GW of power to serve 100M DAU in the base case, of which only ~0.1 GW comes from the CPU/VM layer. Depending on the # of reasoning-equivalent model calls one Muse DAU generates per day, 3-4GW is entirely plausible. Maybe that’s why @Meta is rumored to be adding 7-10GW of compute next year.
The sandbox layer = sub $1B of CPU content and ~$2B of DRAM content, which is much smaller than many expected.
Lot of moving assumptions. Welcome all feedbacks/ pushbacks.
------
Two very different pieces of infrastructure behind Muse.
1. Muse VM / sandbox infrastructure
2 vCPUs, ~8 GB of RAM and ~100 GB of persistent logical storage per user. https://t.co/7rP5vDKnT7
2. Muse Spark inference
Model inference goes out through Meta's external inference infrastructure. https://t.co/e203XUp6jq
------
1/ Sandbox infrastructure
A. CPU
The first mistake is assuming that 100M DAU means 100M VMs are actively consuming compute at the same time.
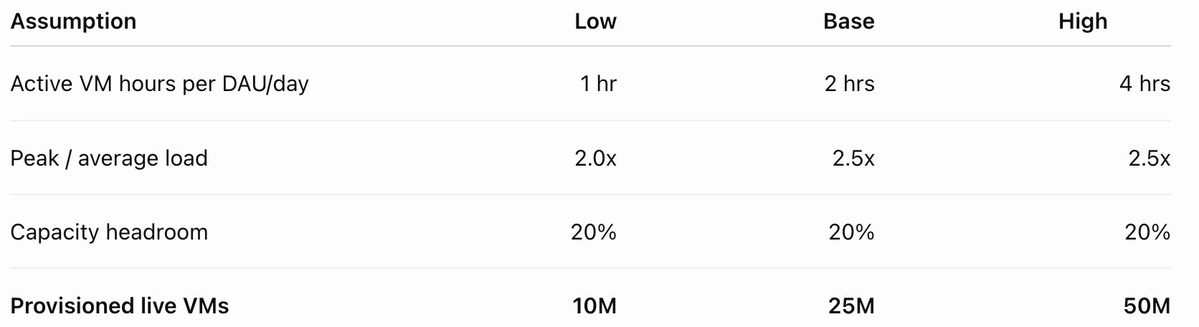
Suppose the average Muse DAU has an agent actively working for two hours per day.
100M users * 2 hours / 24 hours = ~8M average simultaneous active VMs
Meta obviously cannot provision only for the daily average. Usage will be concentrated during waking hours and bursty.
Assume a 2.5x peak-to-average ratio:
8M * 2.5 = ~20M peak active VMs
Then add roughly 20% capacity headroom: ~25M provisioned live VMs. So the base assumption is effectively that Meta needs enough infrastructure to support roughly 25% of DAU being live simultaneously.
The next important distinction is between virtual CPU allocation and physical CPU demand. Agent sandboxes are particularly well suited to CPU oversubscription. They spend a lot of time waiting. During those periods, the VM may still be alive, but it is barely using CPU.
DeepSeek’s recently published DSec infrastructure provides a useful benchmark. Its production agent sandbox platform runs approximately 30,000 physical CPU cores and 250TB of DRAM across ~160 nodes, with peak concurrency above 380,000 sandboxes. https://t.co/PFlgc6nnUs DSec also demonstrates stable operation at around: 800 microVMs per node. With roughly 188 physical cores per node: 188 physical cores / 800 microVMs = ~0.23 physical cores per live VM.
DeepSeek is obviously the King of efficiency. The number for Muse might be at 0.3-0.75 physical cores per live VM, or assume 0.5 physical cores per live VM as the base case. That is equivalent to roughly two simultaneously live Muse VMs per physical CPU core.
Using the base assumptions: 25M live VMs * 0.5 physical cores per VM = 12.5M physical CPU cores.
On a 256-core CPU: 12.5M cores / 256 cores per CPU = ~50K CPUs; Or on a 192-core CPU that would be 65K CPUs.
At the current public pricing, that is ~$800M.
B. DRAM
CPU can be aggressively oversubscribed because a VM that is waiting may consume almost no CPU. Memory is harder to oversubscribe because a live VM still needs to retain its working state.
Muse exposes roughly 8GB of RAM to the user environment, but one observed instance was actually using only around 3GB at the time of measurement.
25M live VMs * 3GB = 75PB of physical DRAM, call it ~75-100PB of physical DRAM feels like a reasonable base range.
At the current public pricing, that is ~$2B.
C. Sandbox power
~0.1 GW for the entire Muse sandbox / VM layer at 100M DAU.
------
2/ Inference
Muse’s personal computer executes tools and stores state locally, but the actual model runs on separate inference infrastructure. Meta’s Muse architecture
Energy per inference event
Microsoft’s 2026 study estimates that optimized frontier-scale inference consumes a median of approximately: 0.31Wh per normal query
But a long reasoning query with roughly 15x the token count consumes approximately 13x as much energy, or around: 4Wh per long reasoning query
The study specifically highlights reasoning and agentic workloads as significantly more energy intensive.
https://t.co/z1YEsvVeMo
Sensitivity analysis on # reasoning-equivalent events per DAU per day
Suppose each active @Muse user generates the equivalent of 50 heavy inference events per day.
At 5Wh each:
100M users * 50 events/day * 5Wh = 25GWh/day
25GWh/day / 24 hours = ~1.0GW average power
So inference alone could require: ~1-2GW of average power
A 3-4GW Muse is entirely plausible. Maybe that’s why @Meta is rumored to be adding 7-10GW of compute next year.
------
The popular framing around Muse is that giving every user 2 vCPUs and 8GB of RAM creates an enormous CPU requirement. But the naive calculation materially exaggerates the CPU requirement because it treats logical VM allocation as dedicated physical infrastructure.
The more interesting conclusion is: Consumer agents may be a meaningful new demand driver for CPUs and conventional DRAM, but inference remains the real compute bottleneck. And as agents do more work, run longer trajectories and increasingly spawn other agents, inference demand can scale much faster than the number of users itself.
+++
Calling my peer review group: @bubbleboi@damnang2@Midnight_Captl@FundaAI@fi56622380 . Feedback/ Pushbacks pls :).
++
Better formatted: https://t.co/qVwYKNr1ZA
Minko Gechev was preparing for a Google interview
Instead of keeping his prep notes to himself, he turned them into a GitHub repo
He collected the problems he actually practiced and organized them around the concepts he was preparing for
No “500 problems in 30 days”
No random problem dump
Just practical interview prep
He also openly points out that solving these problems isn't enough you need strong fundamentals and the ability to explain your thinking during the interview
That repo now has 3K+ stars. 👀
https://t.co/fjlyo7Se4b
Stanford dropped CS329Z today. Engineering AI Agents. compound systems, build RAG/tool use from scratch, then frameworks, then how you actually evaluate this stuff.
gonna follow along online. looks pretty neat.
https://t.co/7To6HNMqxu
@Cristina_AC_X The idea that 'competitiveness' will save human jobs ignores how economic structures actually work. We aren't heading toward a meritocracy; we are heading toward a modern form of neo-feudalism.
most of the humanity will be pushed into a modern 'peasantry'
this paper is f*cking insane
a quant paper combined a Hidden Markov Model with reinforcement learning to shift portfolio allocation on the fly as market regimes change.
the numbers: it beat SPY on risk-adjusted returns, with shallower drawdowns across 2004-2025.
the crazy part is it's not trying to forecast the market at all, it figures out what regime it's in first, then decides the allocation from there.
bookmark it before this thread gets buried.
@PeterSchiff It’s easy to say to someone who has never been a single mom, sick with needy small children, or disabled
the problem isn’t having a social system, but the abuse. As a society, we should have support for those who needs but abuse part should be resolved in this tech era
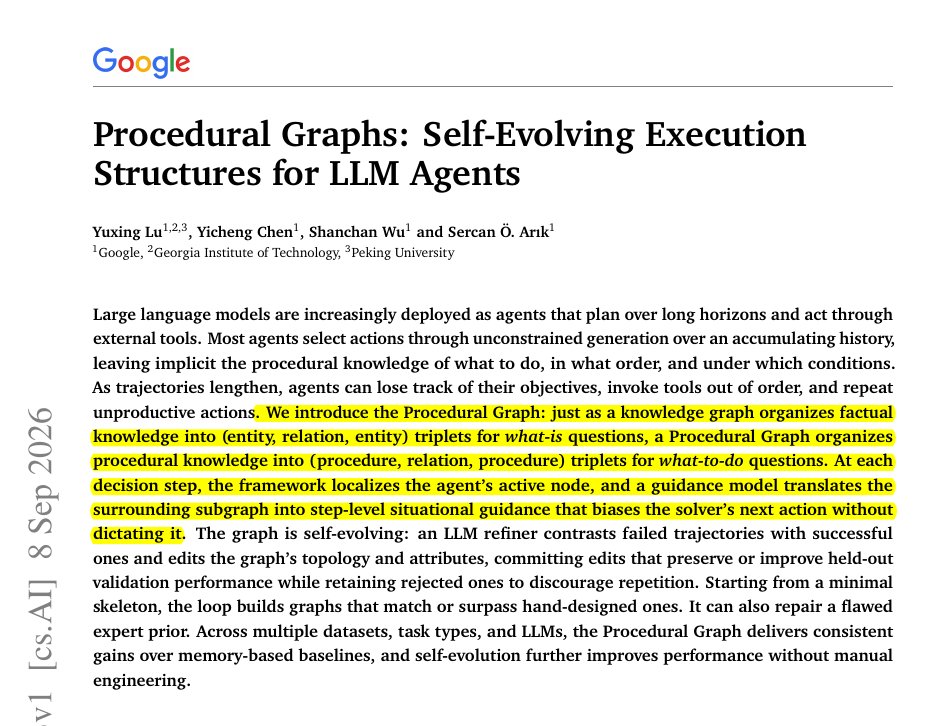
New Google paper shows LLM agents handle long tasks better when their workflow lives in an editable procedure graph that learns from execution, instead of being buried in chat history.
The problem is: as agents run longer, they can forget where they are, repeat tools, or do steps in the wrong order.
Procedural Graphs give the agent a small map of what can happen next, while still letting the LLM reason freely.
After runs finish, another LLM compares successes and failures and edits the map, but an edit is kept only if it does not hurt held-out tasks.
Across 24 model-and-benchmark combinations, the method ranked 1st or tied 1st in 21.
It also repaired a bad human-designed workflow: on MultiChallenge, success went from 58.93% with the flawed graph to 92.86% after refinement.
This guidance costs extra tokens, so it makes most sense when long workflows are the bottleneck.
Overall, it recommends move critical procedures out of chat history and into an explicit, editable workflow that improves from execution.
– arxiv. org/abs/2609.09153
Title: "Procedural Graphs: Self-Evolving Execution Structures for LLM Agents"