Here's an updated anomaly graph for sea-surface temperatures in region Nino 3.4, using the preferred color scheme.
I will be updating these whenever they look crazier than the previous update. That may be daily.
La zona del #Pacífico Ecuatorial (ENSO) supera por primera vez los 29⁰ en el mes de junio, para que os hagáis una idea de la magnitud del asunto, en 2015 (el niño más fuerte desde que hay registros) se dió el 17 de octubre
La actualización del Modelo Europeo apunta entre 3 y 4⁰ de anomalía (actualmente es de +1,4⁰=Niño moderado). Es realmente preocupante!
Los reflejos especulares del sol en la superficie del agua, nos permiten apreciar cómo las presas de la isla acumulan una buena cantidad de agua
Y también gracias a esos reflejos, en el mar, en la costa suroeste de la isla, a sotavento de los vientos alisios, vemos zonas de calma
🔴Red Alert 🔴
Seasonal forecast model shows Super El Niño [turbocharged by climate change] with +3°C in key region that fuels extreme weather around world.
Scientists see potential for strongest El Niño in 150-years. Humanity must prepare for unprecedented extreme weather.
The new ENSO Euro Plumes were released this morning. Hard to believe, but they are even stronger! Some members are even above 4°C! Insane.
I thought it may be helpful to add the color bars to distinguish between strong vs historic events. Truth be told historic starts below +3C but for consistency I started it at 3.
This will be followed by the Relative Nino plots which are honestly only a smidge below the traditional Nino index. 🧵 1/2
Actualmente tenemos dos anomalías que llaman la atención a nivel mundial en la temperatura superficial del mar. Una es el incipiente evento de ElNiño , el cual se prevé que sea fuerte a muy fuerte, en el que el Pacífico tropical se calienta bastante por encima de su media. Las consecuencias son mundiales, especialmente en el continente americano y asiático. Sequías , inundaciones, cambios en el patrón habitual de lluvias.
La otra anomalía es la burbuja fría del Atlántico Norte o Cold Blob, el cuál se relaciona últimamente según estudios a una ralentización de la Amoc (corriente termohalina) lo peculiar es que lleva unas semanas ocupando una gran extensión. Cuando la amoc se ralentiza (que no colapsar) deja de llegar calor húmedo a Europa occidental, los inviernos son bastante más duros, se crea un área de altas presiones en el Atlántico Norte , sube el nivel del mar en la costa este de América del Norte, disminuyen las lluvias en el norte de Europa, entre otras consecuencias.
Hay múltiples estudios que hablan de un posible colapso de Amoc en unas decenas de años.
¿Estamos viendo el inicio?
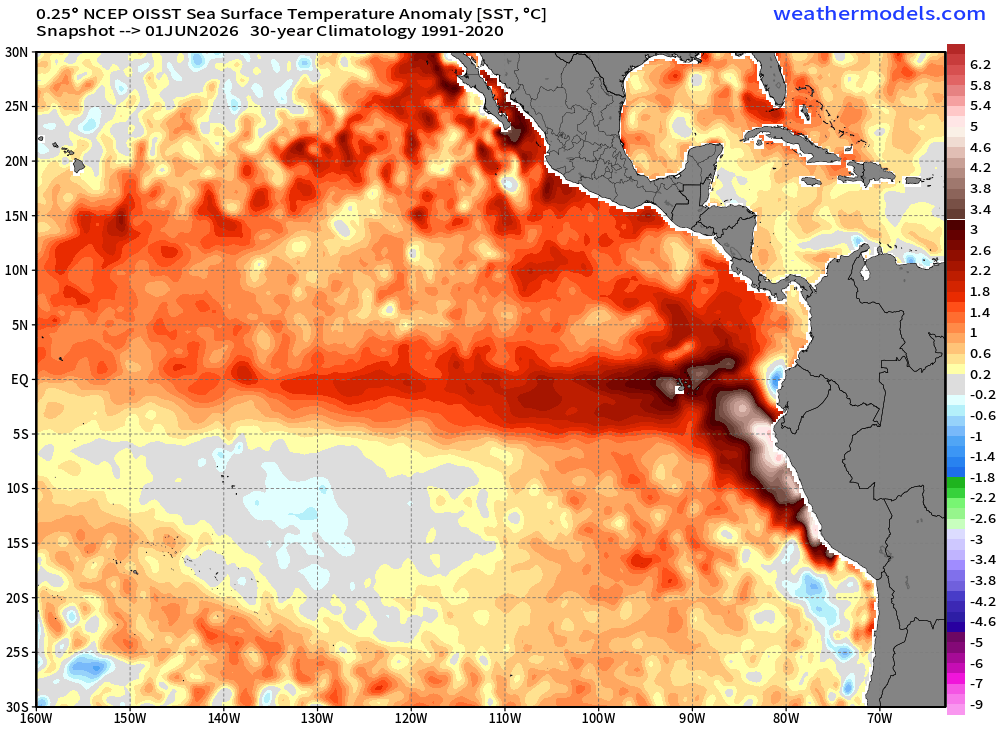
El Niño continues to grow & intensify. As of June 1st, SST's anomalies have now reached 5.5 °C above normal right off the coast of Paita, Peru. Now only that SST's across Niño 3.4 are averaging 29.99 °C with an anomaly running 1.37 °C above normal. Now you're probably thinking, "That's not that significant yet", but climatology is at work here. For example, SST is 29°C in early June; the anomalies wouldn't mean as much, but if the SST were 29 °C in December, that would be quite significant. That's why we are starting to see El Niño grow & strengthen rapidly because SST on a normal average are starting to decrease since late May, but actual SST have remained largely around 29.7-29.9 C over the last few months.
The forecast strength of this El Niño is nothing short of astonishing! Plotted below are all the strongest El Nino’s on record vs the 2026 forecast (thick white line). Look at how deviant this event has the “potential” to be! Forget “Super”, if this verifies it deserves “Supercalifragilistic expialidocious!”
The latest median model ensemble forecast monthly peak via @hausfath calculation is +3.3°C in the Nino 3.4 region in December.
The next closest is 2015 at +2.6-2.8 depending on data source used. Now it’s important to note that this event may not reach that height. Frankly I’d be mildly surprised if it does. But it’s not a forecast out of thin air, it’s the median of 13 models and 643 members, so we’ll see.
(To include 1877 I had to use NOAA PSL link to HadISST data which showed the 2015 event max at 2.6). #elnino
🌊🌡️ Imagen histórica, el Mediterráneo occidental alcanza los 5 a 6 °C de anomalía positiva según el ECMWF
👉🏻Nunca antes en estas alturas del mes de mayo el mar Balear había estado tan caliente.
Peak El Niño median forecast is now forecast ONI at +3.3°C (RONI +2.7°C) up .2°C from last month so far.
If it verifies, it will be by far the strongest El Niño on record.
Thanks @hausfath for the great visual.


![RyanWeather's tweet photo. 🔴Red Alert 🔴
Seasonal forecast model shows Super El Niño [turbocharged by climate change] with +3°C in key region that fuels extreme weather around world.
Scientists see potential for strongest El Niño in 150-years. Humanity must prepare for unprecedented extreme weather.](https://pbs.twimg.com/media/HKDOU21WwAA0zXK.png)


![RyanWeather's tweet photo. 🔴Red Alert 🔴
Seasonal forecast model shows Super El Niño [turbocharged by climate change] with +3°C in key region that fuels extreme weather around world.
Scientists see potential for strongest El Niño in 150-years. Humanity must prepare for unprecedented extreme weather.](https://pbs.twimg.com/media/HKDO5d5XcAAiNTu.jpg)