A sad example of how a lie will fly around the whole world while the truth is getting its boots on.
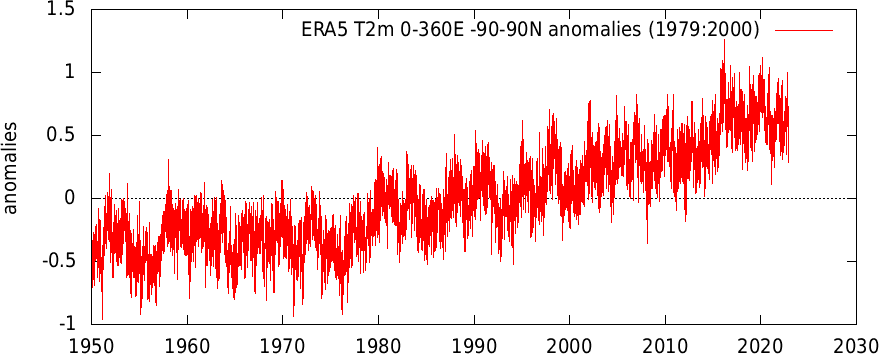
What this graph really shows is a single day's temperatures from a weather model, compared to the 1979-2000 average. Here is what the daily data actually looks like over time:
@LittleKeegs0 Cool. I’ll check it out. Have you read any mazzucato? I just started her book on value and plan to get through the entrepreneurial state as well. It’s heterodox season