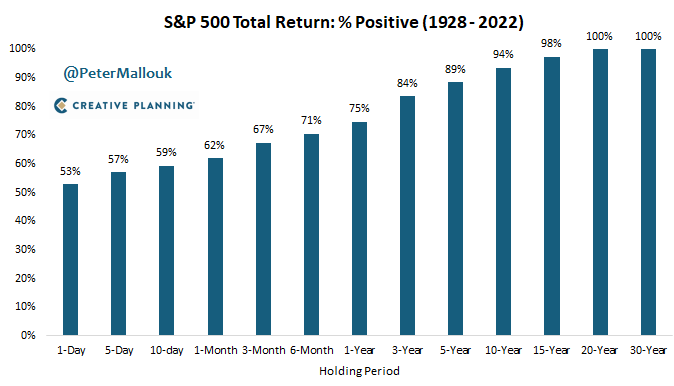
Stocks don’t outperform bonds every year - or even every decade.
But historically, they’ve won far more often than they’ve lost.
For the long run, be an owner - not a lender.
On a rolling 5-year basis, US stocks have now outperformed International stocks for over 15 years.
This is by far the longest run of US outperformance in history.
Happy 4th everyone!
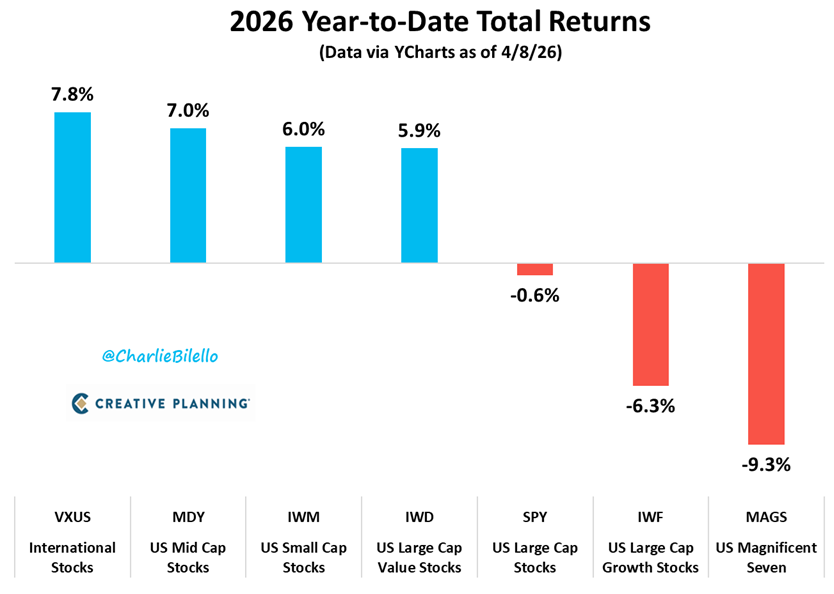
2026 YTD:
-EM/International Stocks > S&P 500
-Value Stocks > Growth Stocks
-Small & Mid Caps > Large Caps
-Mag 7 in the Red
The Reversal of Everything....
Video: https://t.co/KvIKNbxfUH
The S&P 500 has returned an average of 12% per year since 1980 and has done so despite an average intra-year drawdown of 14%, and often drawdowns that are much worse.
The lesson? Volatility doesn’t equal a permanent financial loss unless you sell.
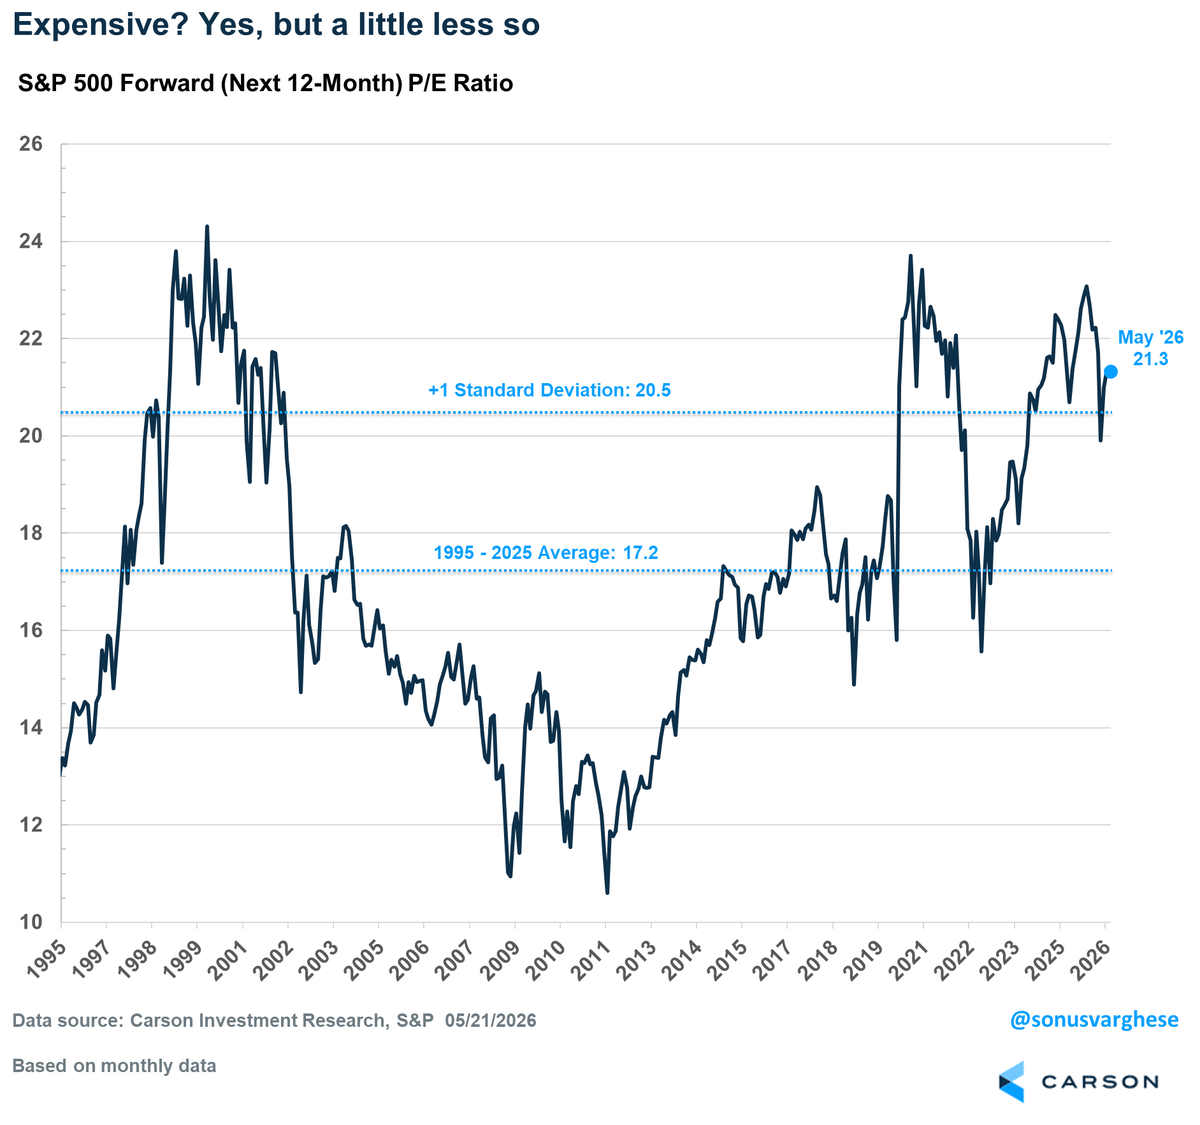
The S&P is up about 9% YTD.
12-month EPS estimates are up an incredible 14%.
In other words, stocks are cheaper now than they were at the start of the year.
Any random day is up 53% of the time, but the longer you hold, the higher your chances of a positive return go.
So many say the stock market is rigged. It isn't, but if anything, it is rigged to go higher. Don't fight the casino.
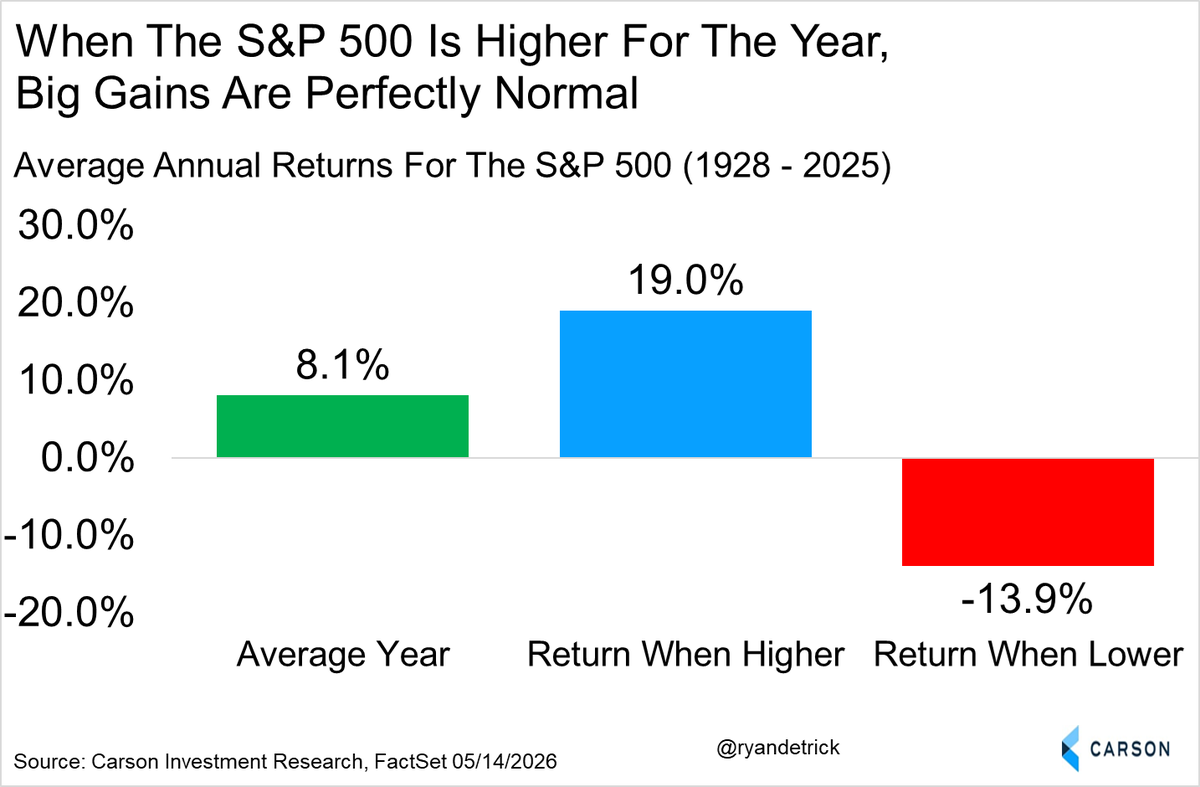
Good reminder that the average up year for stocks is up 19.0%. In other words, it is perfectly normal to see larger moves should stocks be higher on any random year.
We shared this last year, but amazing how well it played out.
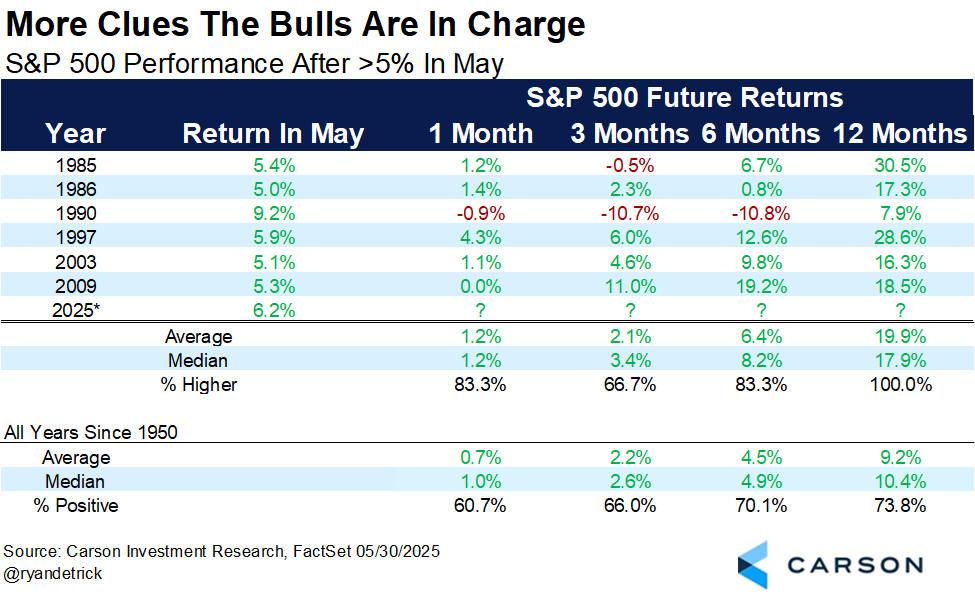
Historically, no month sees better future returns when it is up >5% than May. Up 19.9% a year later and never lower.
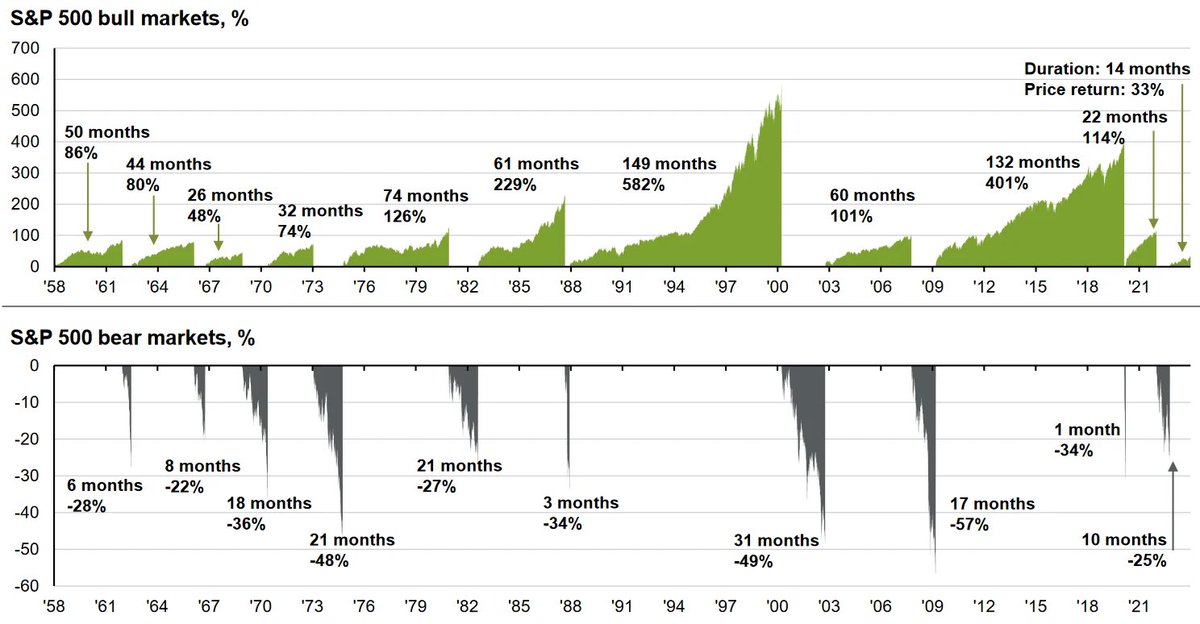
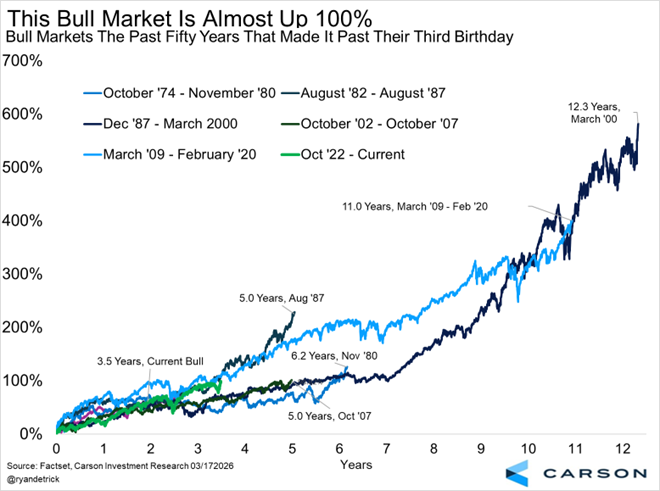
The current bull market is 3.5 years old and up 99.2%.
As we've noted many times, once bull markets get past their third birthday they rarely end anytime soon.
Over the past past 50 years, 5 made it past their 3rd birthday and those lasted eight years on average.
2026 YTD:
-International Stocks > US Stocks
-Small & Mid Caps > Large Caps
-Value Stocks > Growth Stocks
-Mag 7 names all lagging
The Reversal of Everything...