Why did Uber build thousands of microservices? No better person to answer than Uber's first CTO, Thuan Pham. Timestamps:
00:00 Intro
05:32 Getting into tech
16:09 The dot-com bust
20:42 VMware
26:29 Getting hired by Travis at Uber
33:22 Early days at Uber and scaling challenges
40:57 Uber’s China launch
47:12 The platform and program split
50:26 From monolith to microservices
53:38 Internal tools at Uber
57:05 Helix: Uber’s mobile app rewrite
59:55 Thuan’s email about naming
1:02:03 Org structure changes under
1:06:34 Thuan’s work philosophy
1:12:23 The “three tours of duty” at Uber
1:15:37 Why Thuan left Uber
1:17:34 Coupang and Nubank
1:21:59 Faire
1:25:31 How Faire uses AI
1:28:24 AI’s impact on software engineering
1:31:09 The role of the CTO
1:35:13 Career advice
Brought to you by:
• @statsig – The unified platform for flags, analytics, experiments, and more. https://t.co/ZCSOIcWv31
• @WorkOS – Everything you need to make your app enterprise ready. https://t.co/xUBBN8VuwQ
• @SonarSource – The makers of SonarQube, the industry standard for automated code review. Check out SonarQube Advanced Security: https://t.co/WbRTb55FL6
Three interesting parts from this conversation:
1. The program/platform split came before microservices.
The concept of cross-functional “program” teams and dedicated “platform” teams became necessary because an org split across backend, frontend and mobile engineers slowed down in execution speed when Uber grew to around 100 engineers. Every feature required negotiating bandwidth across the mobile, backend, and dispatch teams. Thuan, Travis Kalanick, and Jeff Holden literally used color-coded sticky notes with people’s names to reorganize into self-sufficient teams. We cover more about this split in this The Pragmatic Engineer deepdive, The Platform and Program split at Uber: https://t.co/E4W3FJ07Gj
2. Expect multiple rewrites during hypergrowth.
The right architecture depends on how fast a product and company are growing. At Uber, repeated rewrites were common because each one “bought” another window of survival for the company. Thuan’s recommendation is to understand that a rewrite simply means a company is outrunning its existing architecture: this is not necessarily a bad thing!
3. Uber is the only major company that had a “Senior 1” and “Senior 2” level – and Thuan is unapologetic.
Thuan introduced the Senior 1 (L5A) and Senior 2 (L5B) levels because the jump from senior (L5) to Staff (L6) became very big, and larger than between previous levels. One problem this split level created was that Uber’s L5B was akin to Google’s and Facebook’s L6/E6. Thuan resisted the title inflation of just renaming L5B to ‘Staff’.
I'm trying something new with my blog, making it interactive
first article is about something I care deeply about: logs
logging sucks so much
https://t.co/mdFhxEvpjB
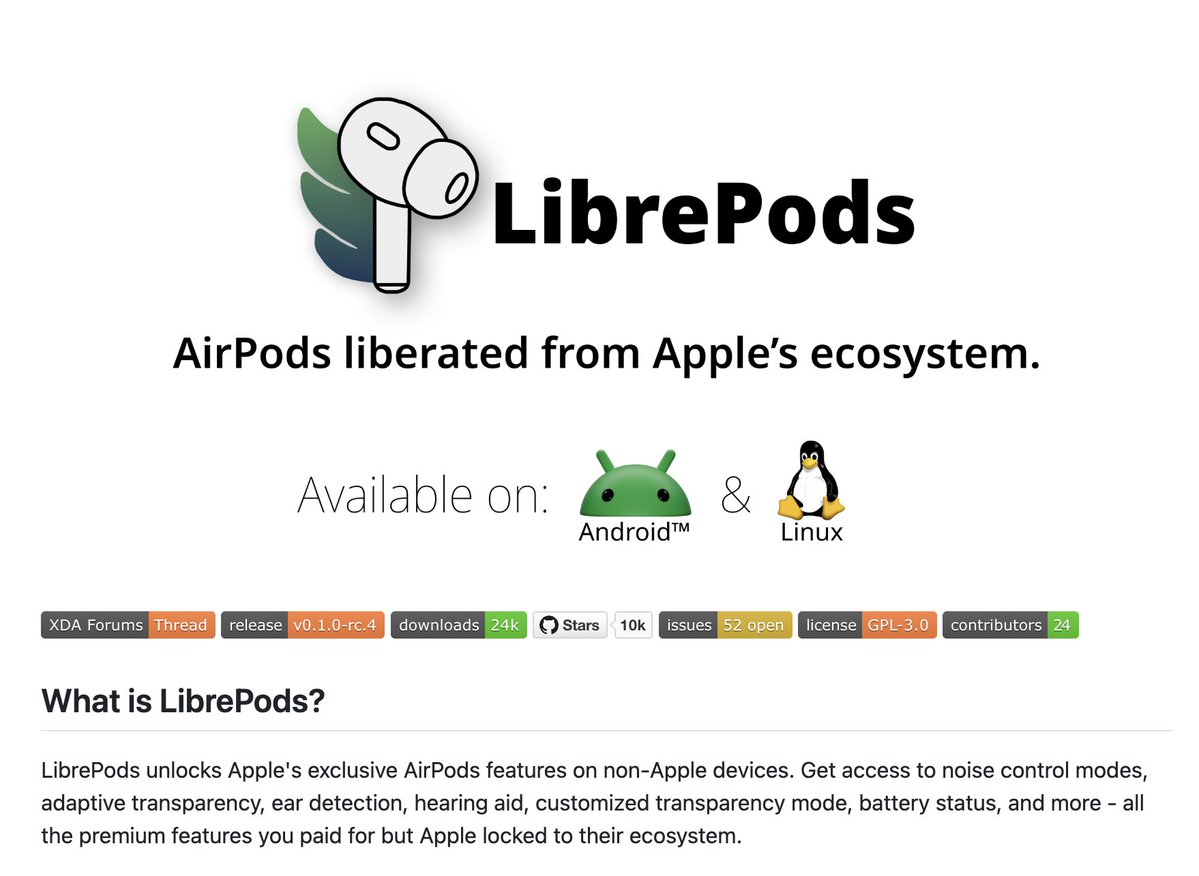
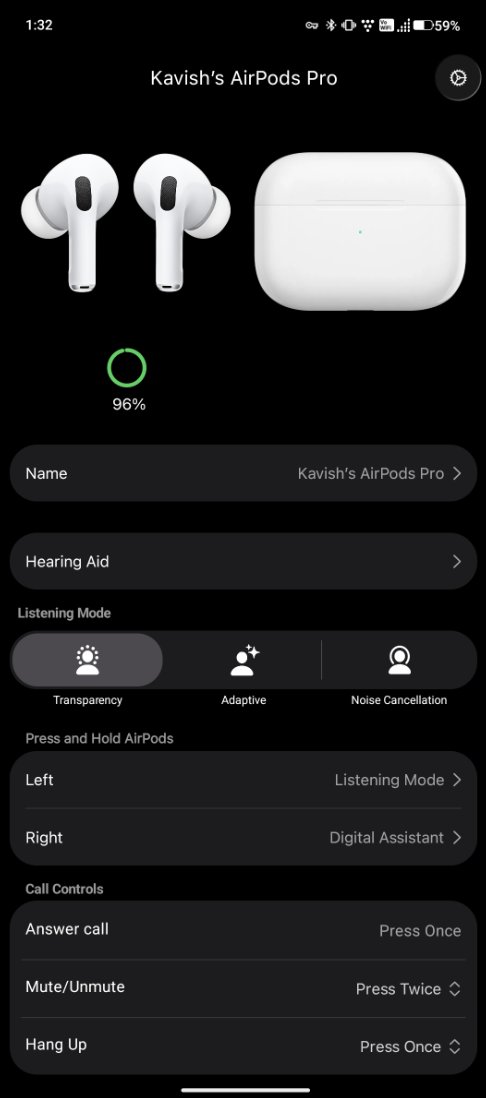
Indian developer reverse engineered the protocol that AirPods use to communicate with Apple devices and implemented those features on Android (and Linux) |
Exploring @karpathy Nanochat through a Knowledge Graph
Love how this project combines simplicity with power.
Want to navigate and understand the entire repo?
Check it out here: https://t.co/X0gr0WAq79
Plus, you can connect it via MCP to any AI coding assistant and work directly on the repository.
Powered by @deepgraphMCP@AIatMeta and @GroqInc
Github 👨🔧: Awesome-GraphRAG
A curated list of resources (surveys, papers, benchmarks, and opensource projects) on graph-based retrieval-augmented generation.
github .com/DEEP-PolyU/Awesome-GraphRAG
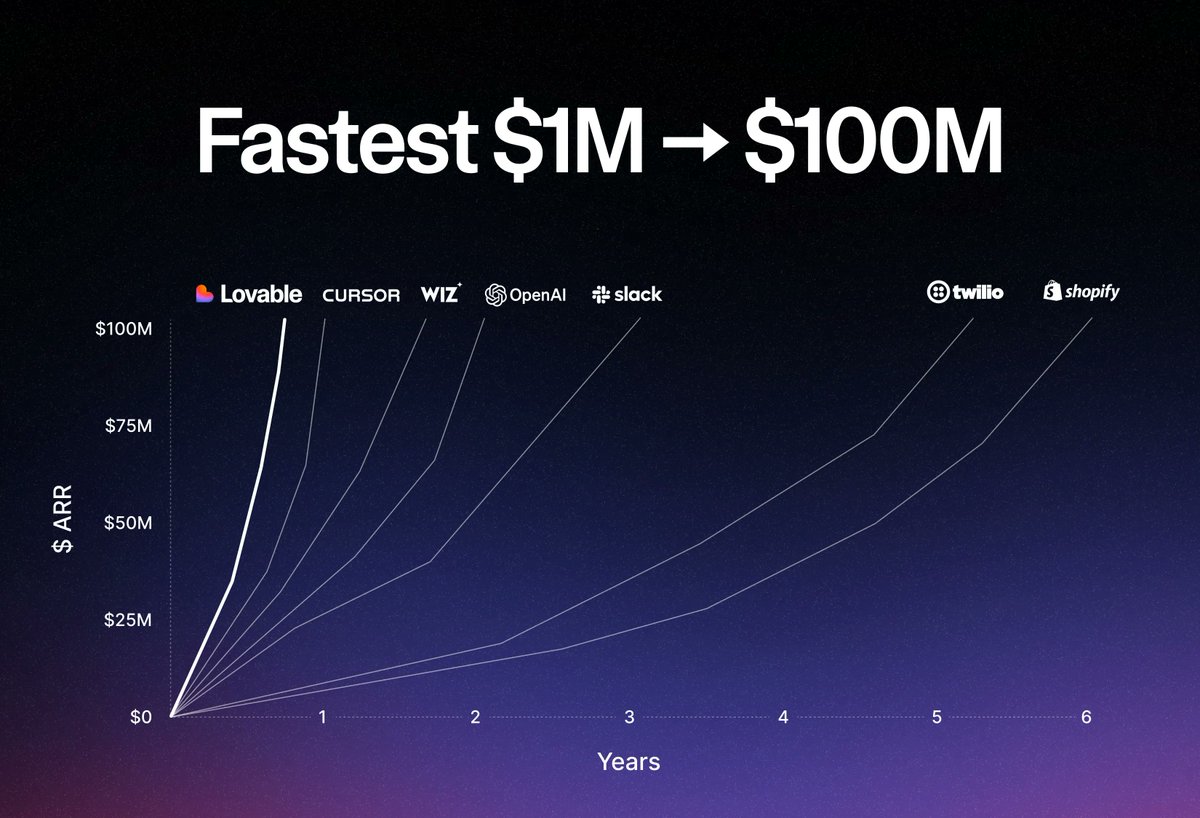
Lovable just crossed $100M ARR in 8 months.
Faster than OpenAI, Cursor, Wiz, and every other software company in history.
Today we're launching a game-changing update, it reduces the error rates by 91%.
Introducing Lovable Agent:
Apple just dropped a killer open-source visualization tool for embeddings — Embedding Atlas — and it’s surprisingly powerful for anyone working with large text+metadata datasets.
This reminds me of Nomic's Atlas, but I never got around to using it 😅
We’re talking real-time search, multi-million point rendering, and automatic clustering with labels.
One of their showcase examples visualizes ~200K wine reviews using embeddings + metadata like price, country, and tasting notes. And it is lightning fast even on my browser! No separate code needed!
It nails what most LLM devs need but often hack together:
✅ UMAP projections
✅ Faceted search across metadata (e.g. “country vs. price”)
✅ Hover + tooltip on raw points
✅ Interactive filters, histograms, and cluster overlays
✅ Cross-linked scatterplot + table views
Under the hood:
• Fast rendering using WebGPU (with WebGL fallback)
• Embedding-based semantic similarity search
• Kernel density contours for spotting clusters or outliers
You just upload your .jsonl or .csv with text + vector + metadata. It handles the rest: clustering, labeling, UI layout, everything.
This feels like the LLM-native version of Tableau — but optimized for text, chat and modern data needs
If you’re building RAG evals, search tuning, clustering explainability, or even dataset audits — this could be your new favorite tool.
We just hit $100M ARR in 8 months 🔥
Faster than OpenAI, Cursor, Wiz, and every other tech company in history.
And today, we’re launching our most powerful update yet:
Introducing Lovable Agent:
→ 91% fewer build errors
→ Smarter reasoning
→ Real dev-like behavior
Instead of following your prompts, Lovable now thinks, takes actions, checks its work, and keeps going until it’s done.
It reads files, debugs logs, searches the web, and builds products like never before.
With this new update, it now feels less like a tool and more like a teammate.
The old Lovable helped us go from $1M to $100M ARR.
Today's update will (hopefully) take us to $1B.
LFG





![TheAIWorld22's tweet photo. 𝟕𝟎 𝐓𝐨𝐮𝐠𝐡𝐞𝐬𝐭 𝐈𝐧𝐭𝐞𝐫𝐯𝐢𝐞𝐰 𝐐𝐮𝐞𝐬𝐭𝐢𝐨𝐧𝐬
Mandatory Bookmark
► Thread [1/20] https://t.co/uUHq8Z0L5m](https://pbs.twimg.com/media/Gy2oH9uWMAA1clt.jpg)