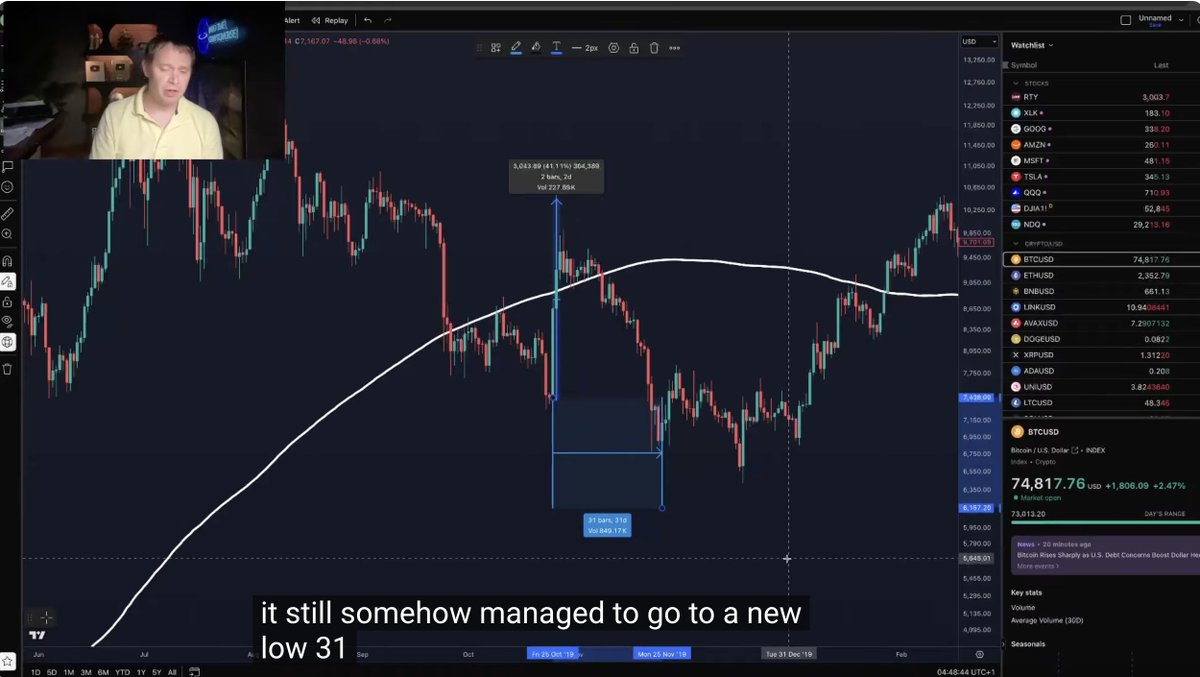
Damn, Benjamin Cowen isn't fully invalidated yet.
In 2 out of 4 bear markets, we had a 20% plus rally within a couple of days, but then found a new low a month or two after.
In October 2019, Bitcoin pumped by 40% within 2 days, but then went to a new low 31d later. https://t.co/RZaDMQEGNc
In Sept '22, there was a 20% rally within 6 days in 2022, which took 71 days until it brought in a new low. https://t.co/pOqTxK9Id1
An hour of agentic computer use may now be cheaper than an hour of human labor:
Computer-use agent: $6-8
Offshore outsourced talent: ~$10
US talent: $30-45
"The math only gets better - inference keeps getting cheaper, and open-source models are getting good enough for a growing share of these workflows."
The data on computer-use agents, from @fabrisera2000, @seema_amble, and @zephratic: https://t.co/eOO1JIrT1J
BREAKING: US data center construction spending jumped +46% YoY in June, to a record annualized rate of $68 billion.
This marks the largest YoY increase in 12 months.
Since January 2024, US data center construction spending has surged +158% and has more than tripled since 2022.
Meanwhile, office building construction spending has declined by over -$25 billion since 2022, to ~$43 billion, the lowest since 2016.
As a result, data center construction has now surpassed office construction by $25 billion, the widest gap on record.
By comparison, office construction exceeded data centers by $57 billion in 2022.
AI is prompting the biggest investment wave in US history.
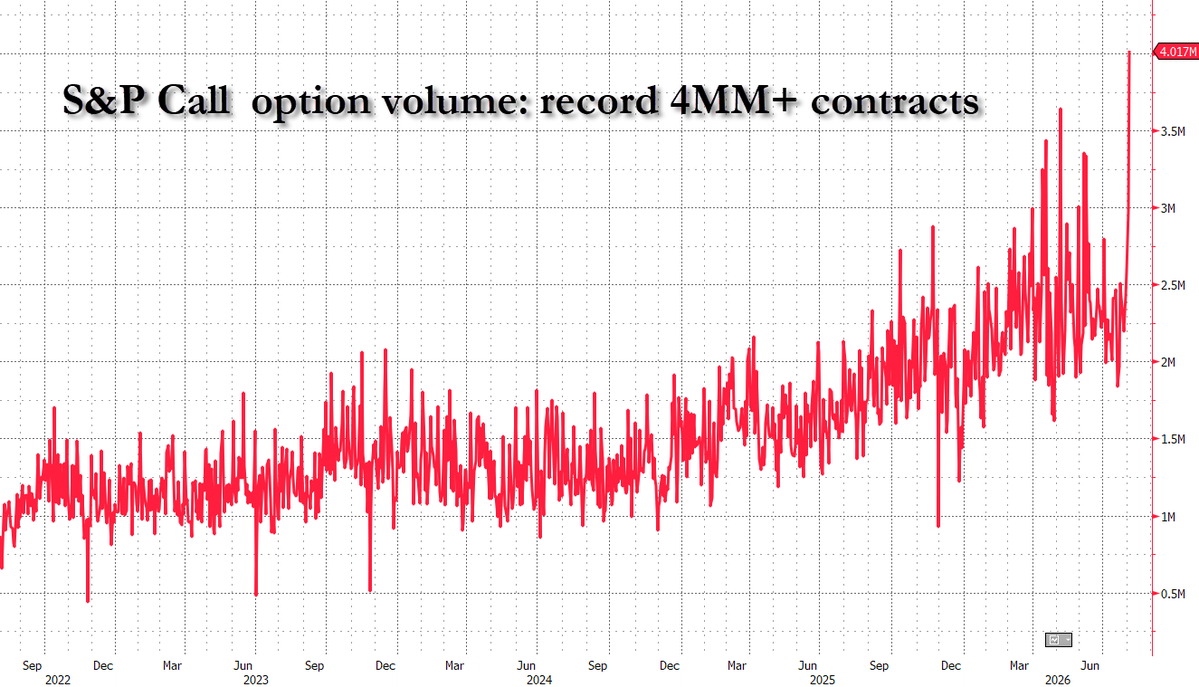
Goldman's Peter Callahan: "V-Shaped: NDX now up ~945 bps in just 4 sessions (since last Thursday), punching back above its 50-dma to the upside. This 4-day move stacks up with how Tech has traded out of (or during) other notable market “events” over the last 20 years (GFC, COVID, ’22 Hiking Cyle, Liberation Day, et al).
Why the big move? Cleaner positioning + improved technicals [Mo’ factor bounce and/or reduced levered ETF footprints, et al] + tidier valuations [NDX fwd P/E at a ~10% discount to its 5 year avg] + strong(er) fundamentals / visibility [e.g improved ROIC sentiments post earnings last week]. As a sentiment check, i would note a number of investor questions yday/today on the “feel” out there – e.g. squeezy? hated rally? Signs of re-risking? Catalysts? Semis vs Hyperscalers? Chase or technical bounce?"
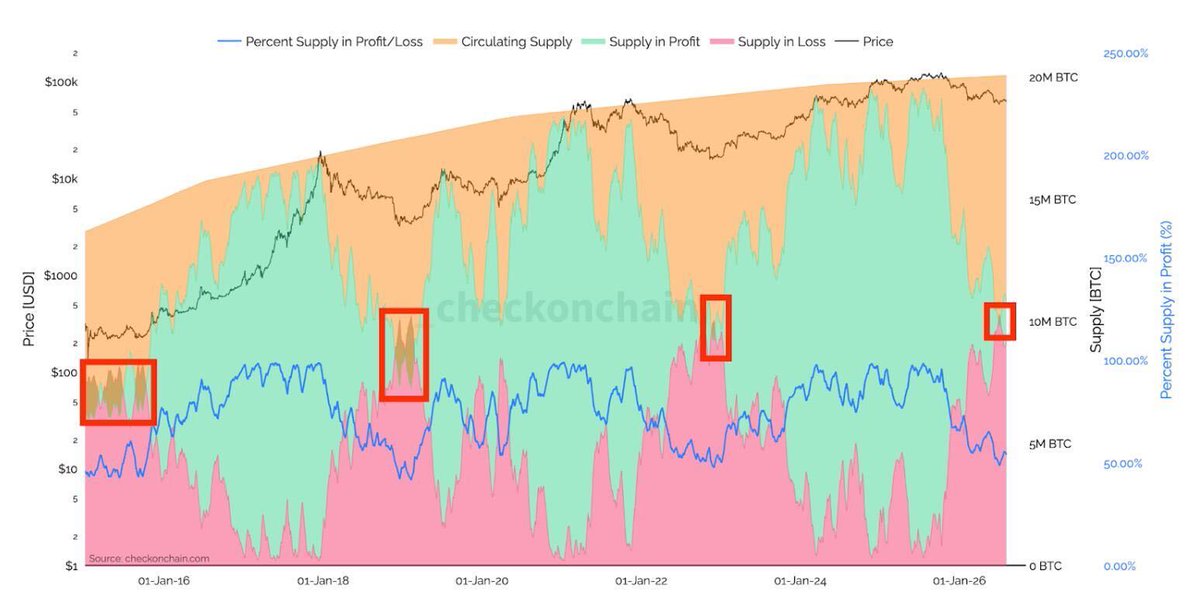
BTC supply in profit sits at 54.6 percent, leaving the average holder near breakeven.
Short-term holders are taking small losses, with STH-SOPR at 0.9971. Capitulation usually appears below 0.95.
This price action points to a pivot, with supply rotating across cohorts.
"CTA positioning is becoming more fragile. According to Nomura's Charlie McElligott, the three-month trend is the biggest driver of CTA equity positioning, accounting for more than half of the current long signal in the S&P 500 and most of the long exposure in the Nasdaq 100 and Russell 2000.
That trend is now starting to weaken as stocks move lower. If markets continue to fall, either quickly or gradually, the model could eventually flip from long to short, forcing CTAs to sell. The S&P 500 would see by far the largest selling pressure, with roughly $25.5 billion of futures potentially coming to market." - Nomura
^ biggest risk to crypto imo is we get a var shock and correlations go to one and just as crypto starts to look good relative to equities we get drug down by the algos.
Hedges are off, shorts are closed, and ETF flows have flipped positive.
What bitcoin:native needs now is confirmation at the Short-Term Holder Cost Basis at $69k; rejection there puts the lower demand shelf back in play.
Read the full Week On-Chain report👇
https://t.co/erjeVr0OYn
Goldman Sachs went back to 1980 and found 11 times the long/short Momentum factor rallied more than 20% in three months. Then it tracked what happened next.
The average episode peaks around month one at roughly +5%, fades for the following two months, and spends the back half of the year going nowhere in particular.
The current episode did something different. It ran to +16% by month two, more than triple the average path, above the 80th percentile band the whole way up.
It gave all of it back in under three weeks. The thing about a crowded factor is that the crowd is the position. When the same names sit in every book, there is nobody left to buy them and nobody left to sell the shorts to.
The good news? Once the shakeout ends, the uptrend will resume.
BUY FEAR !
The one chart to keep for October.
Sixteen years of VIX spikes. Every apocalypse was a reload.
– VIX 20–30 → stay alert
– VIX 30–45 → activate booster
– VIX 45+ → go MAXIMUM
Greed is obvious. Fear is the edge.
When cannons fire, buy.
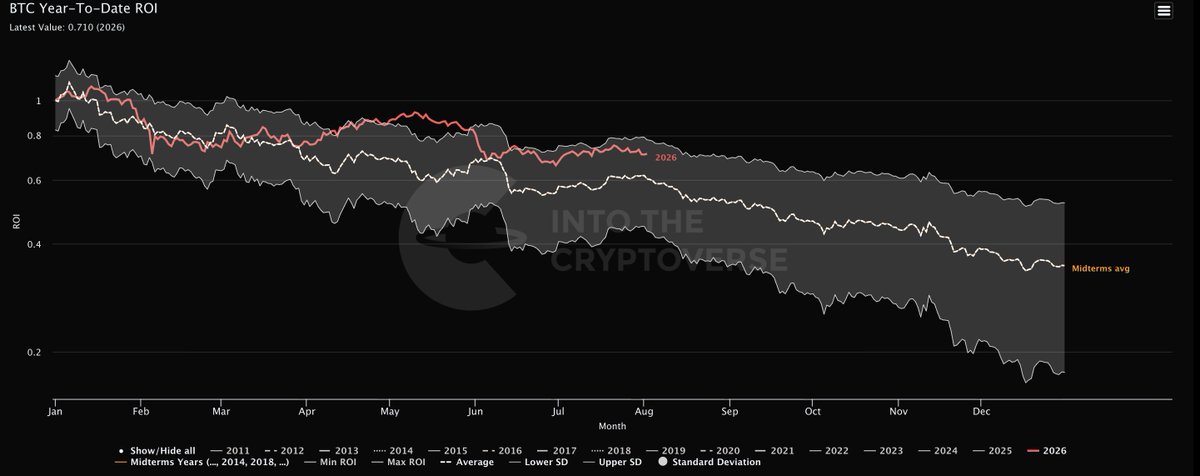
2 of 7. The mid-term map
1974 — Ford: −35%
1978 — Carter: −15%
1982 — Reagan: −17%
1986 — Reagan: −10%
1990 — Bush I: −20%
1994 — Clinton: −8%
1998 — Clinton: −22%
2002 — Bush II: −34%
2006 — Bush II: −8%
2010 — Obama: −17%
2014 — Obama: −10%
2018 — Trump: −20%
2022 — Biden: −27%
Ten mid-term years. Ten drawdowns. The low usually lands in the back half. Often Q3.
2026 is a mid-term year.
We are in July.
Realized Price #Bitcoin is currently at ~$52k
Historically, during the bottoming process of #BTC bear market, the price has fallen below the Realized Price
We use an oscillator to accurately identify these periods, which last an average of 7 months.
The current price discount is already extremely favorable — we use the 2.618 Fibonacci extension to project top relative to Realized Price and the target is ~$138k — about +116% from current price.
This setup for projecting a Bitcoin top has high accuracy and has identified excellent distribution periods.






![zerohedge's tweet photo. Goldman's Peter Callahan: "V-Shaped: NDX now up ~945 bps in just 4 sessions (since last Thursday), punching back above its 50-dma to the upside. This 4-day move stacks up with how Tech has traded out of (or during) other notable market “events” over the last 20 years (GFC, COVID, ’22 Hiking Cyle, Liberation Day, et al).
Why the big move? Cleaner positioning + improved technicals [Mo’ factor bounce and/or reduced levered ETF footprints, et al] + tidier valuations [NDX fwd P/E at a ~10% discount to its 5 year avg] + strong(er) fundamentals / visibility [e.g improved ROIC sentiments post earnings last week]. As a sentiment check, i would note a number of investor questions yday/today on the “feel” out there – e.g. squeezy? hated rally? Signs of re-risking? Catalysts? Semis vs Hyperscalers? Chase or technical bounce?"](https://pbs.twimg.com/media/HO5yDg3WMAEYnLr.png)