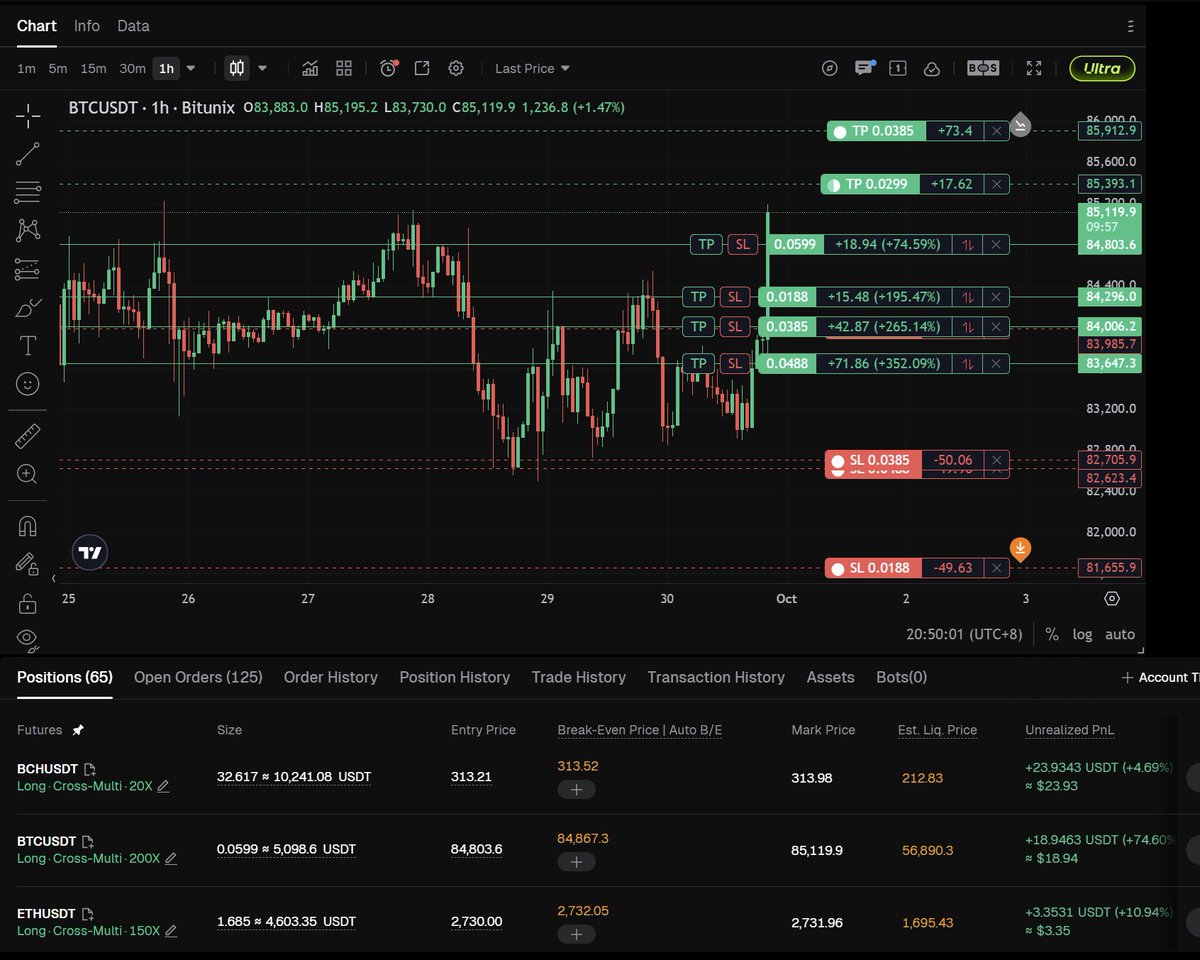
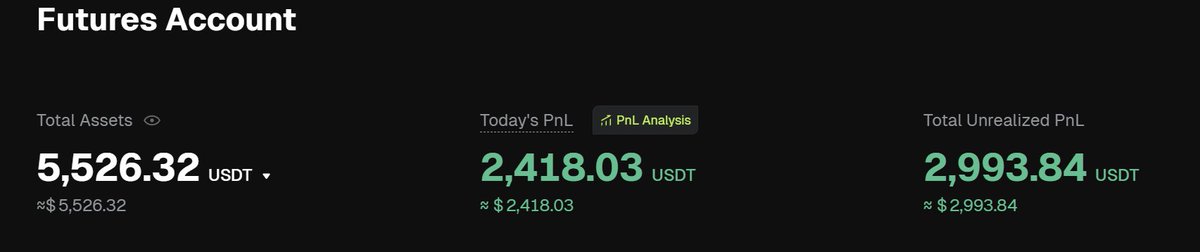
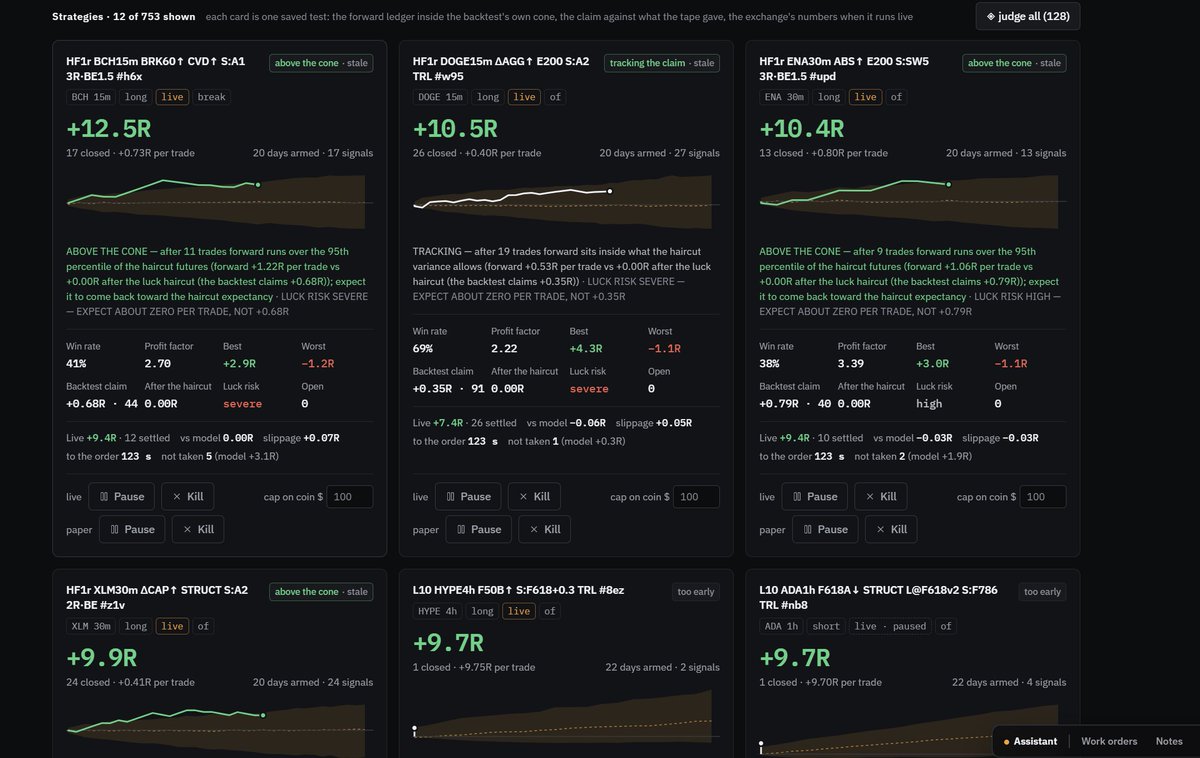
Automated trading of complex strategies is one of the primary focuses of the Risk Lab. Here is where the engine stands.
What it is: build a complex strategy in the Lab, backtest it, arm it, and the engine trades it. On paper, or live on your own exchange account.
How complex a strategy can be:
• Entry: one trigger, or a confluence of up to 4 signals inside a window, drawn from 115+ order-flow and structure detectors plus indicator signals and breakouts.
• Filters: 33 condition kinds, stackable. EMA position, oscillator ranges, session and weekday windows, CVD slope, delta extremes, open interest regime, funding, liquidations, whale flow, FVGs, BOS/CHoCH structure, prior day/week levels, volume profile, auto fibs, auto trendlines, Wyckoff phases, liquidity zones, moon phases
• EXCEPT vetoes that block a signal (one armed strategy carries 9)
• Higher-timeframe context on any line, oscillator or regime term
• Stops by ATR, percent, a level or a swing. Fills at market or as a resting limit at a level
• Up to 4 target rungs, by R or at a level
• Up to 8 management rules: break-even, stop to +R, partials, exit, trails (ATR, percent, swing, ratchet, level, line), fired by R reached, bar count or a condition. Time stops
• Charts from 1m to 1d. One position at a time, or every signal
2,824 strategies are armed right now. Median 5 rule parts each, the biggest 17.
What it has executed in testing :
• 6,082 live signals judged · 3,473 orders sent · 3,118 positions opened on real exchange accounts · 2,917 settled · ~200 open now
• 564 distinct strategies traded live, 41 coins
• 3,167 stop moves and 2,367 target placements made on the exchange by the engine
• 9,495 more signals on paper forward tests
• ~55,000 engine passes
How accurately it executes (live vs the model; whether the strategies are any good is a separate question):
• Entry fill vs the model's entry: median 0 bps, mean +0.9 bps (+0.006R)
• Realized R vs model R over 2,632 paired closes: mean −0.007R, median −0.004R. 71% land within 0.1R of the model, 90% within 0.25R, 97.6% the same outcome sign
• Independent replay audit (Sept 16): 1,695 of 1,714 signals reproduced on the settled tape, 99.0%. 0 of 1,220 filters and 0 of 558 vetoes read differently
• Every open live position carries a verified stop on the exchange (199 of 199)
• Every skipped signal carries its reason: a cap, margin, an expired limit
@CrypDoMillions@TroutZander@luckychartape Its important to understand that Risk lab doesn't simply provide a strategy for you, its tools that allow you to build/backtest/automate your own strategies
Folks!
I’m reposting this for anyone who may have missed my original post below.👇
I just have to say it again…
I’m completely blown away by what @luckychartape has created with "Risk Lab".
I know I’ve mentioned it a few times now, but seriously, if you could see what I’m seeing behind the scenes, your jaw would drop.
I’m STILL getting my head around everything this trading platform can do. It’s an absolute powerhouse.
And the crazy part?
Lucky is STILL building.
More tools. More data. More functionality. More ways to actually TEST whether what you think you know about the market is true.
The man doesn’t stop. I’m beginning to wonder if he even sleeps 😂
Just look at the data this thing is producing.
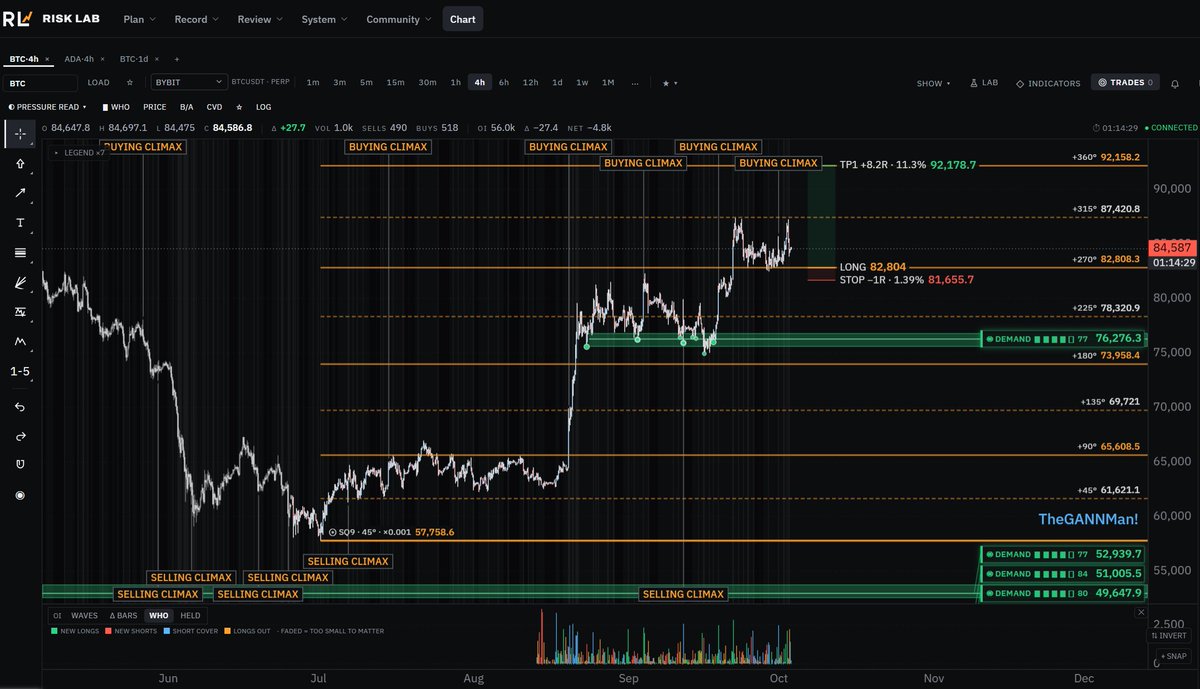
And then look at the second chart 👇
Those are my Gann SQ9 levels projected from the most recent low.
Watch how price interacts with the geometry:
90° ~ first harmonic resistance.
Then price launches straight through to 270°.
Pullback into 180°.
Then a double tap around 315°, helping define the current range.
And now we’re potentially setting up for the completion of one full 360° rotation around the geometry of the circle.
This is exactly why I love combining Gann with hard data. One gives me the geometric framework, and the other allows me to measure, test and validate what I’m actually seeing.
Now I’ll finish with this…
Whenever I read posts like this myself, I’m usually immediately suspicious because I HATE sales pitches.
So let me make something very clear:
Lucky doesn’t need your money.
And neither do I.
I’m sharing it because when I come across something I genuinely believe provides incredible value to serious traders, I’m going to talk about it.
The tools are there.
The data is there.
The ability to test your edge is there.
What you do with it is entirely up to you.
Take it or leave it.
Your trading.
Your edge.
Your choice.
But if you’re serious about proving what actually works rather than simply believing it works…
The "Risk Lab" is one hell of a beast. 🔥🔥
Trading is lonely. It doesn't have to be.
Most traders build alone: a few indicators, a hunch, a strategy nobody else has ever checked. In Risk Lab, you're not alone in the lab.
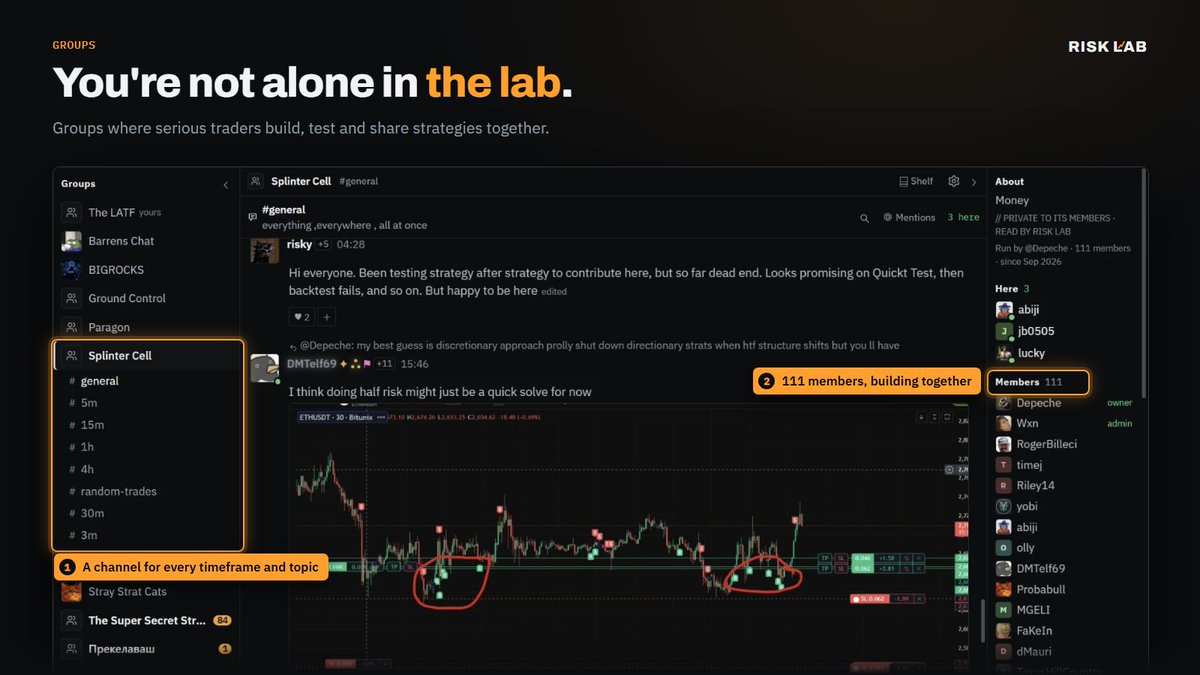
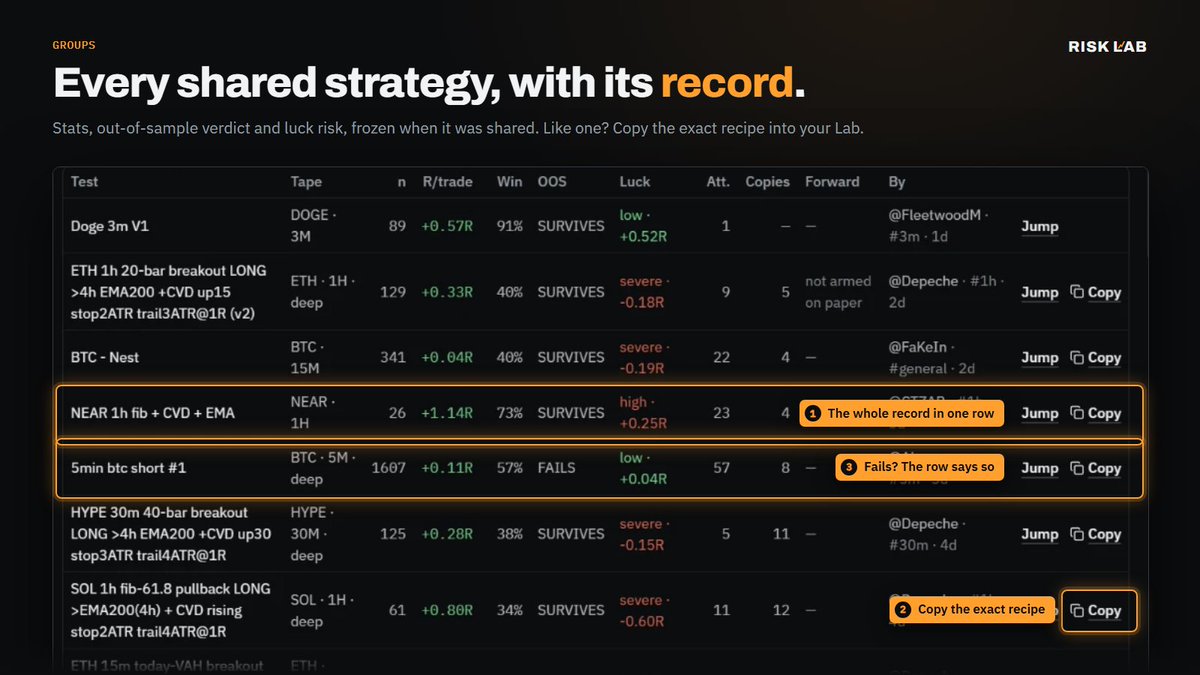
👥 GROUPS
Members run groups where serious traders build, test and share strategies together. There's a channel for every timeframe and topic, members comparing notes on what actually works. One member shared eight strategies in a single post, each arriving with its curve, expectancy, win rate and profit factor.
📚 THE SHELF
Every lab test, plan and thesis shared in a group lands on its shelf, so you see everything the group has built in one table. Each strategy carries its record, frozen the moment it was shared: trades, R per trade, win rate, the out-of-sample verdict, and its luck risk, meaning how much of the result could be chance. If a strategy fails out of sample, its row says so.
📋 ONE CLICK TO COPY
Like what you see? Copy it. The exact recipe goes into your own Lab: same rules, same entries, same stops and exits. Run it on your coins, test it on your timeframe, forward-test it on live data. The Copies column shows how many members already took it.
This is what building an edge looks like when you do it together: shared openly, measured honestly, and sharpened by everyone who tests it.
Find your group → https://t.co/bhnoopSED7
Most trading tools show you the chart. Risk Lab shows you the statistics.
We built the lab around one idea: every decision you make as a trader should come with a number attached.
📈 CHARTING
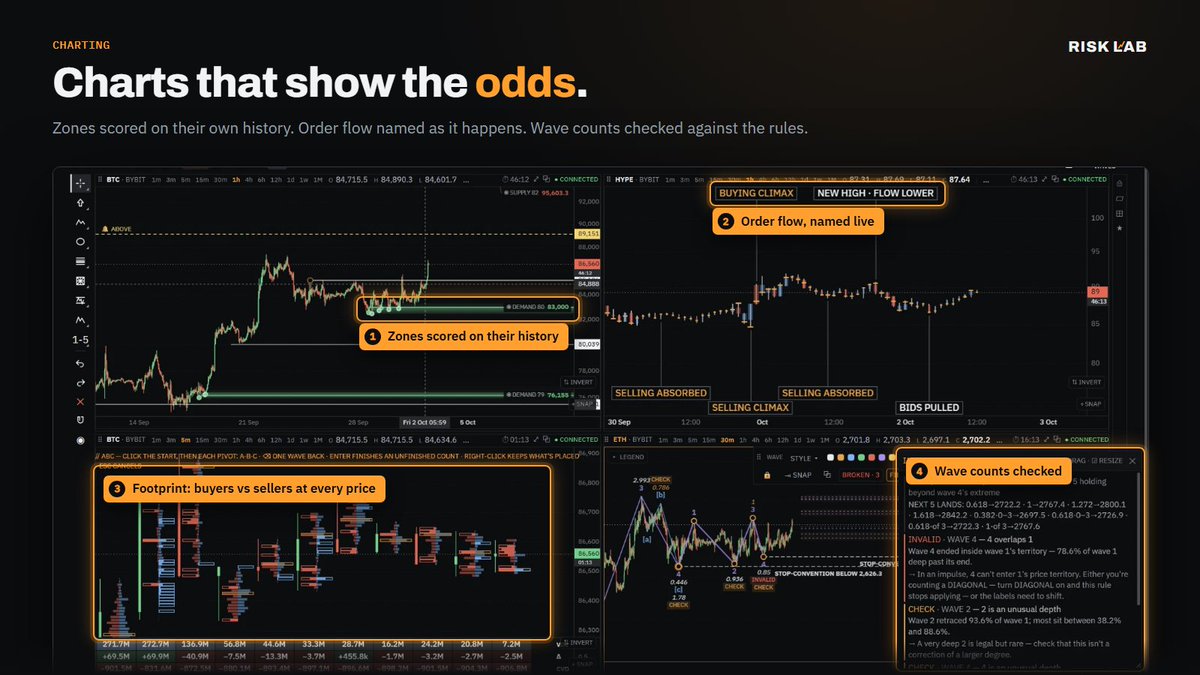
Every supply and demand zone is scored on its own history. Click one and the lab tells you how often zones like it held, how far price ran after each test, and how often price came back from this distance, with the confidence interval right next to the number.
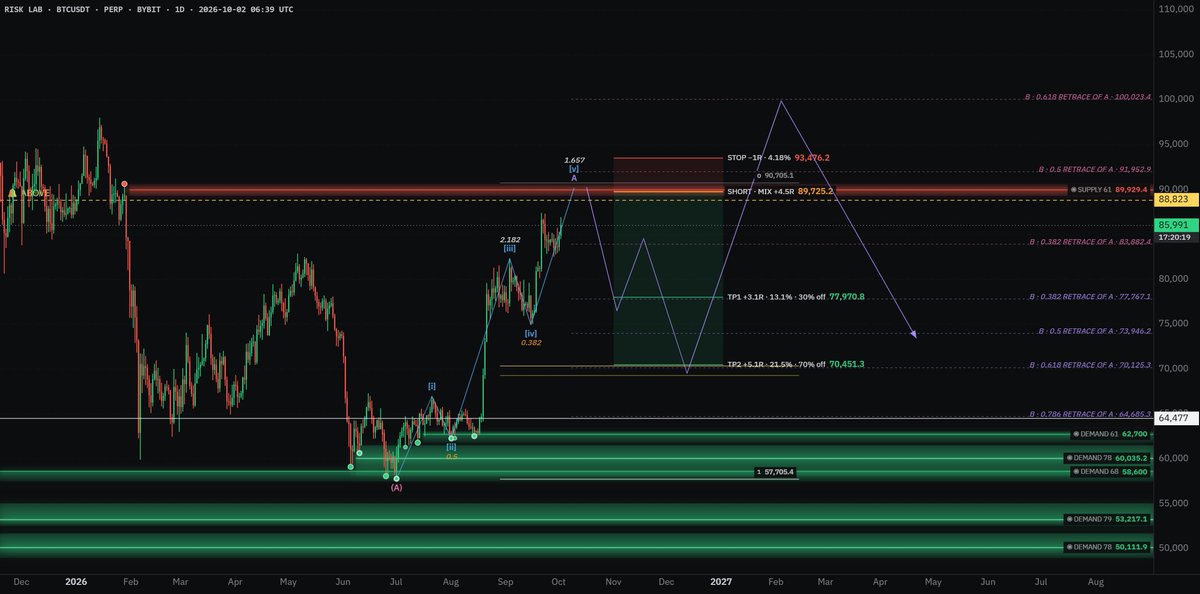
Order flow is named as it happens: buying climax, selling absorbed, bids pulled. The footprint shows buyers vs sellers at every price inside every candle. Draw a wave count and the lab checks it against the rules, and tells you when wave 4 just broke your impulse.
👥 COMMUNITY
The Floor is where traders show their work. Plans are filed before the entry and scored after it. Every playbook carries its live record: win rate, average winner in R, how often it trades, and every win and loss on a dot strip you can't hide. Rank them by sample size or expectancy, not by who has the most followers. Watch members trade live, ask questions, copy a plan.
📓 JOURNAL (free)
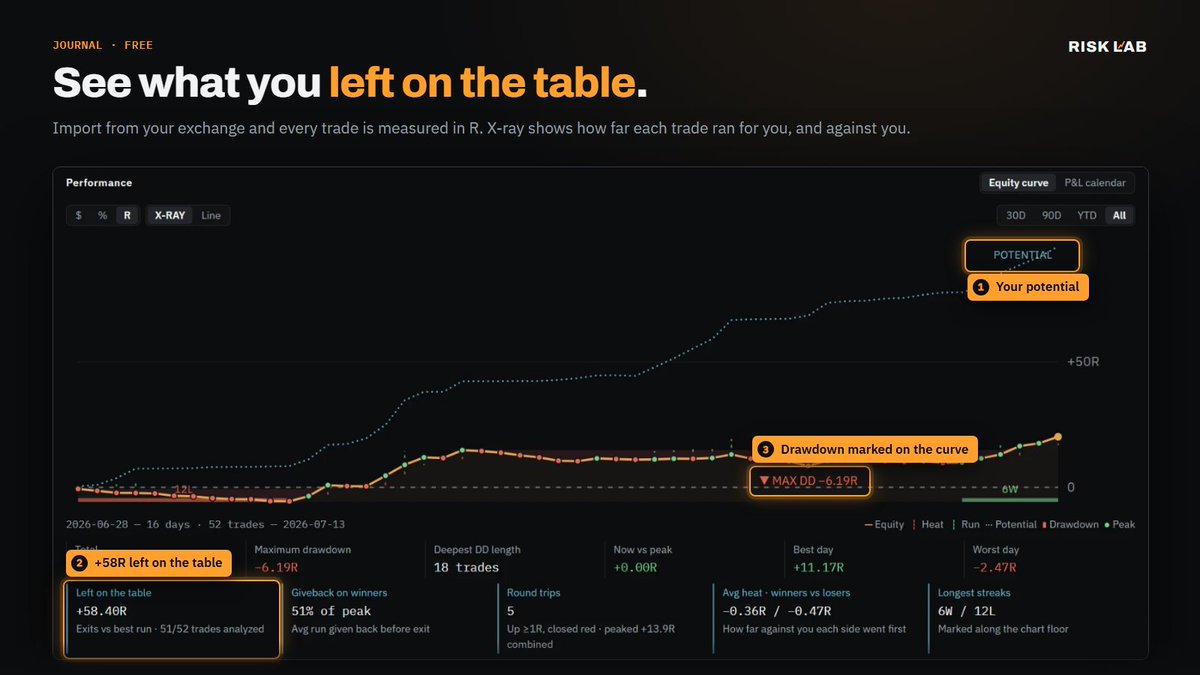
Import from your exchange and every trade is measured in R. The X-ray view shows how far each trade ran for you and against you, plots your potential next to what you actually took, and puts a number on it. Most traders don't have an entry problem. They have an exit problem, and now they can see it.
Charts with the odds. A community with receipts. A journal that tells the truth.
Start free → https://t.co/bhnoopTcsF
Most trading tools show you the chart. Risk Lab shows you the statistics.
We built the lab around one idea: every decision you make as a trader should come with a number attached.
📈 CHARTING
Every supply and demand zone is scored on its own history. Click one and the lab tells you how often zones like it held, how far price ran after each test, and how often price came back from this distance, with the confidence interval right next to the number.
Order flow is named as it happens: buying climax, selling absorbed, bids pulled. The footprint shows buyers vs sellers at every price inside every candle. Draw a wave count and the lab checks it against the rules, and tells you when wave 4 just broke your impulse.
👥 COMMUNITY
The Floor is where traders show their work. Plans are filed before the entry and scored after it. Every playbook carries its live record: win rate, average winner in R, how often it trades, and every win and loss on a dot strip you can't hide. Rank them by sample size or expectancy, not by who has the most followers. Watch members trade live, ask questions, copy a plan.
📓 JOURNAL (free)
Import from your exchange and every trade is measured in R. The X-ray view shows how far each trade ran for you and against you, plots your potential next to what you actually took, and puts a number on it. Most traders don't have an entry problem. They have an exit problem, and now they can see it.
Charts with the odds. A community with receipts. A journal that tells the truth.
Start free → https://t.co/bhnoopTcsF