Information about the NASA Giovanni system will now be available from @NASAEarthdata - go there to see what's new in Giovanni in our 21st year and beyond!
Last week the GES DISC presented a Webinar demonstrating several data tools, examining the huge June 2020 Sahara dust outbreak. If you missed it, watch it here: https://t.co/9QjvdWxqQo. We'll have an open discussion this Friday on the Earthdata Forum - see next tweet.
Water temperatures measured by @shoresta100 at Scripps Pier have broken more records: yesterday's 77.2 surface temp was a day record for August 20 and today's bottom temp of 76.1 is an overall record high. https://t.co/EtoNcd4jdm
We hope you enjoyed this "puzzling" introduction to the correlation map visualization option in Giovanni. Thanks to everyone who looked at the images and pondered their meaning!
The Giovanni correlation maps shown in the puzzler don't compare values directly; rather, they indicate whether the variation of the values correlates positively (both variables increase or decrease together) or negatively (as one increases, the other decreases).
Compare the previous plots to these time-series for the region, for just the period May-June-July 2011. It appears the correlation was dominated by the increase from May to June, as there was little variation in either variable from June to July.
Giovanni puzzler answer: this comparison happened while wondering if surface albedo provided good (though coarse resolution) ground cover information. So I compared the annual average to the 3-mo May-June-July average, presumably when vegetation is greenest. Comments?
Researchers established a relatively low cost method that could help countries with limited monitoring capabilities measure particulate pollution in their skies.
@AguGeohealth@GEOHealthWAHub@UMCOHSE
Story by @KateWheeling
https://t.co/hfALv4ZDsv
A series of lightning strikes set 29 fires ablaze in Northern California on or around 8/17. #SuomiNPP captured this image of the fires, which are causing widespread evacuations, on 8/18. Near-surface smoke can be seen blanketing much of the region and drifting over the Pacific.
Thanks for all the responses to the puzzler so far! Tomorrow (Thursday, August 20) we'll show the maps of each variable (with the time periods shown) so you can see why the correlation maps differ. Today, if you haven't pondered these, you can keep thinking about them.
A Giovanni puzzler: two correlation maps for periods in 2011 shown here. Variables are Normalized Difference Vegetation Index (NDVI) & MERRA-2 surface albedo. NDVI indicates vegetation cover & greenness, albedo indicates reflectivity. Anyone want to explain the patterns?
A Giovanni puzzler: two correlation maps for periods in 2011 shown here. Variables are Normalized Difference Vegetation Index (NDVI) & MERRA-2 surface albedo. NDVI indicates vegetation cover & greenness, albedo indicates reflectivity. Anyone want to explain the patterns?
While counting July 2020 science papers citing Giovanni, we found one that discusses Giovanni. Shen, S.S., etal (2020) 4DVD visualization and delivery of the 20th century reanalysis data: methods and examples. Theoretical and Applied Climatology, 12 p. https://t.co/dNL4glHuL4
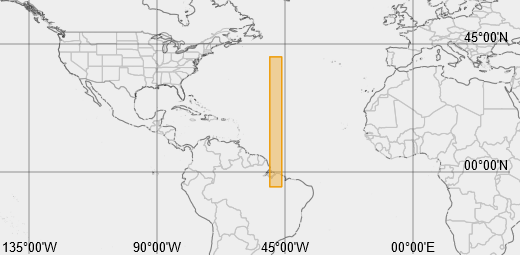
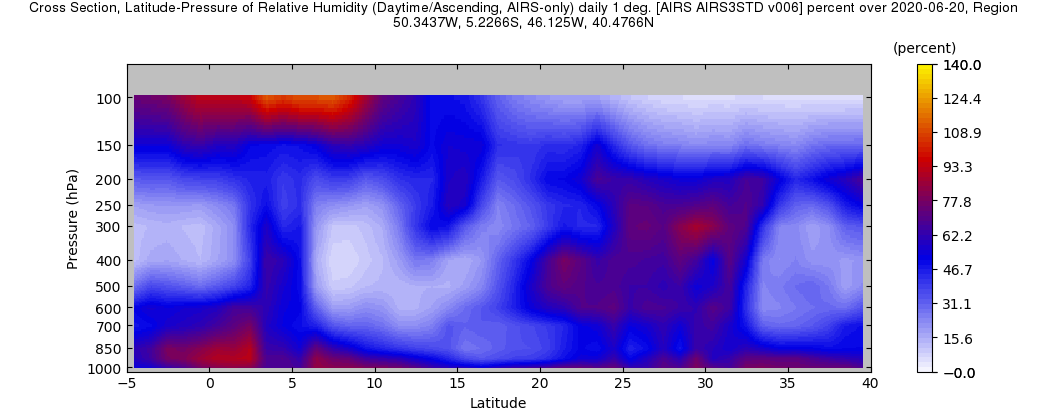
Well, since no one tried to guess -- this atmospheric cross section created by Giovanni shows relative humidity on June 20, for the region shown here. The "core" of the dust storm's dry air was between 5-10 degrees N latitude. We also created one with a different color range.
This afternoon we gave a Giovanni demonstration at the NCAS-M Professional Development Workshop: https://t.co/1GS7yNBn3G This image was included in the demo. Can you figure out what it shows, and why we showed it? (The info in the title helps.) #NOAA#NASA@NASAEarthData
This afternoon we gave a Giovanni demonstration at the NCAS-M Professional Development Workshop: https://t.co/1GS7yNBn3G This image was included in the demo. Can you figure out what it shows, and why we showed it? (The info in the title helps.) #NOAA#NASA@NASAEarthData
Received early notice that this interesting paper used Giovanni (for #precipitation data). Weyer, N.M., et al. 2020. Increased diurnal activity is indicative of energy deficit in a nocturnal mammal, the aardvark. Frontiers in Physiology, 11, @FrontPhysiol https://t.co/iO16aNvVIt