This X profile will be shutting down. I will still use my personal at @ProbableChris and the NQ Stats website will stay up as well. Just consolidating my social media to make it easier to manage. If you don’t follow me at @ProbableChris, give a follow, as thats where all things NQ Stats will be discussed going forward.
i try my absolute best to stay out of drama but this is fucking gold
@lanto_trades posted yesterday he made $500k after only buying 40 accounts with vest. edited the account names to reflect 40-50ish.
then accidentally uploads the uncropped screenshot of account 819. deletes. reuploads the cropped version.
you too can probably make $500k after 819 yolos.
This X profile will be shutting down. I will still use my personal at @ProbableChris and the NQ Stats website will stay up as well. Just consolidating my social media to make it easier to manage. If you don’t follow me at @ProbableChris, give a follow, as thats where all things NQ Stats will be discussed going forward.
The NQ Stats website has added a "Coaching" tab. This is where you can inquire about coaching related to personal process improvement or specific NQ Stats content via deep dives. Learn more at https://t.co/Y7GLmLs5D3
The specific point value isnt really the focus. The idea is just ensuring you have enough distance to scalp after a sweep. If the prior hour high for example is only 2pts away from the current hours open, a sweep will not provide any distance to scalp. Waiting for setups that have a larger distance between will provide viable trades.
Hey Cleazzy. First, Hours Stats is not a trading framework/model, its just a stat. Provides a % probability derived from historical data. There is a million ways to trade that data.
Second, to answer your question, holding past the mean reversion point is where Max Adverse Excursion (MFE) would come into play. Between your entry and reverting back to the hours open, how far does price keep going before it comes back to your stop loss? This data will provide mean and median values. This lets you know how far you "could potentially" hold on average.
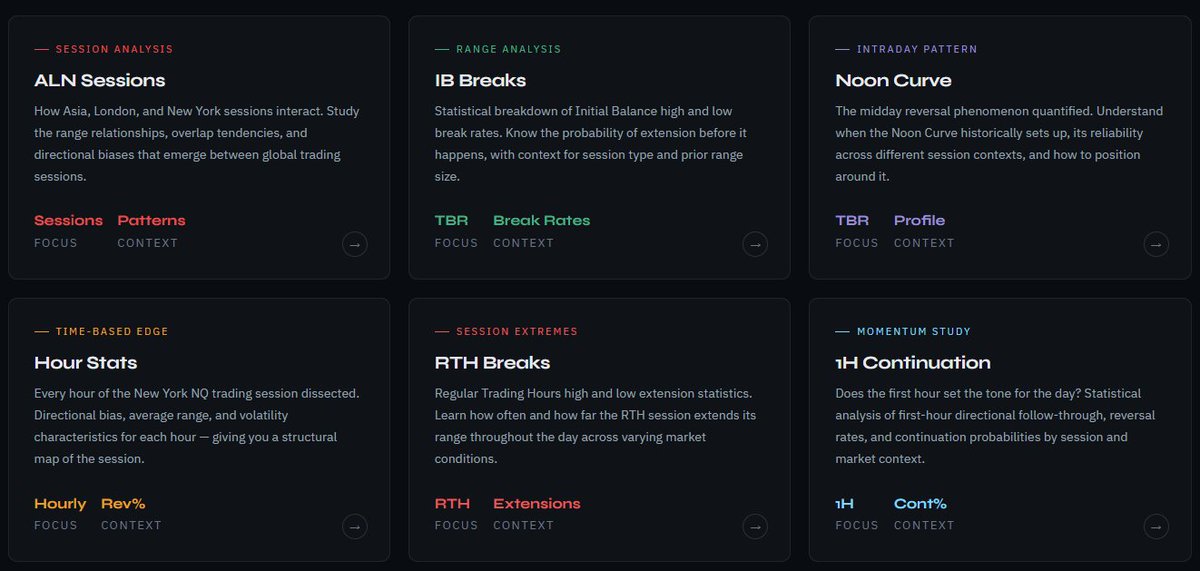
NQ Stats currently focuses on the 6 modules listed below, providing a primary focus and a specific context for each. Coming Soon --> Frameworks around price distribution and multi-module confluences.
https://t.co/ZrwcDvrJWb
New vid for the new site on "Price Distributions". "Price Distributions" is a statistical framework I use to tell what regime we are in, what my bias should be (trend vs mean reversion), and when to time my entries. It uses percent net change from open to close of various time windows to calculate samples and derive data from said sample.