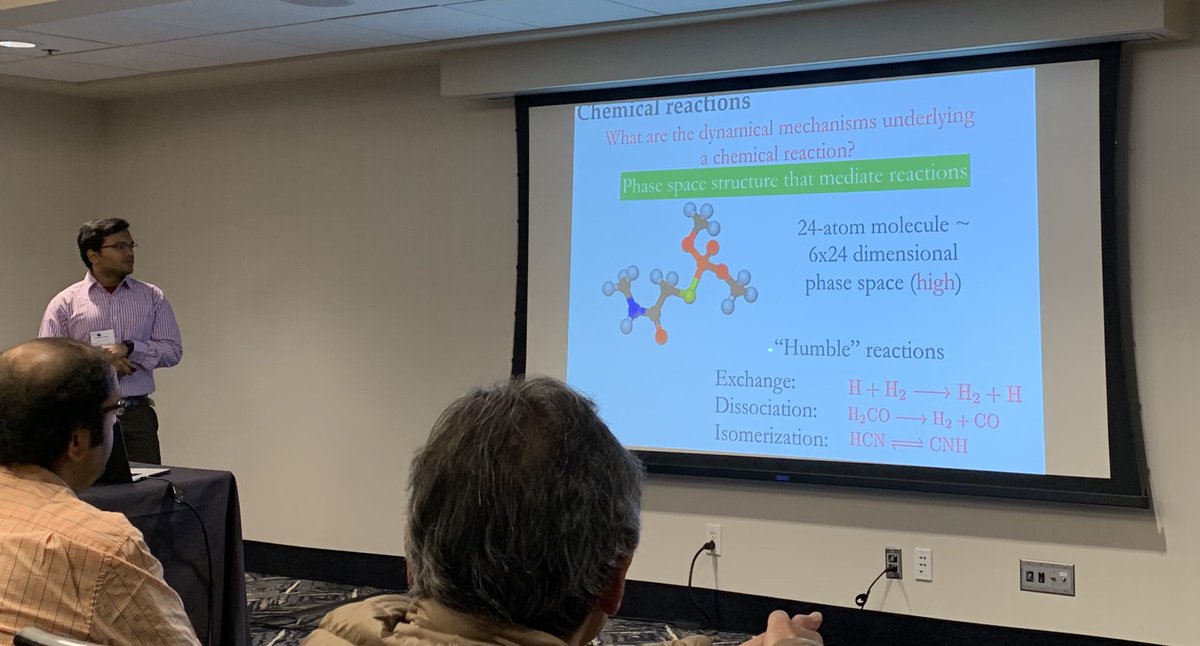
Using Lagrangian descriptors to estimate phase space objects related to chemical reactions, by Dr. Shibabrat Naik at #SIAMDS19 (Virginia Tech PhD alum in #EngineeringMechanics)
Great inspiring (and entertaining!) talk by Professor Eva Miranda at GSI'23:
"From Alan Turing to Contact geometry: towards a "Fluid computer”"
❓Can fluids simulate any Turing machine ❓
Thank you very much @evamirandag for the opening keynote talk!
https://t.co/IRhB2etcrp
@fermatslibrary 2/2 The assumption of small amplitude oscillation makes it sensible to expect a finite answer for a very very long pendulum as the length gets replaced by R in the usual formula. As @danfalk pointed out and fun to know, this is close to the time to orbit Earth at a low altitude.
@fermatslibrary 1/2 It is an intriguing result and highlights why deriving from first principles is a good practice. However, this is the situation of a very very long pendulum (compared to Earth's radius) and not one with infinite length (1\length goes to 0).
Yoshiki Kuramoto's Moser Prize Lecture was posted yesterday on SIAM's YouTube channel: https://t.co/fTDlCV4ABS Enjoy!
"Exploring the World of Coupled Oscillators"
#SIAMDS23
Prof. Eva Miranda delivers the second talk in her Hardy Lectureship Tour at the London Institute, on how Turing techniques and modern geometry can construct a ‘fluid computer’, as part of a workshop on Navier-Stokes regularity, fluid computing & machine learning. @evamirandag
📊🎨 Ever wondered how to transform your raw data into a compelling scientific graph? Let me guide you through it. Here's a simple way to create a graph using any graph plotting software and enhance it using various vector editing tools:
Step 1️⃣ Data Plotting: Begin with your raw data. Input your data into your chosen graph plotting software and select the chart type that best represents your information.
Step 2️⃣ Customization: Adjust your axes, gridlines, labels, and title for clarity. Consider adding error bars or statistical significance indicators if relevant to your data.
Step 3️⃣ Exporting: Once you're happy with your graph, export it as a PDF or SVG file to maintain the quality and allow for further editing.
Step 4️⃣ Vector Editing: Open your exported file in your chosen vector editing tool - be it Adobe Illustrator, CorelDRAW, Inkscape or Affinity Designer.
Step 5️⃣ Enhancing: Now comes the fun part - enhancing your graph. Use the vector editing tool to adjust line thickness, colors, and font size. While adding effects or gradients can be tempting, remember that simplicity and clarity are key in scientific figures.
Step 6️⃣ Annotations: Add annotations or labels directly in your vector software to make your graph more informative and easier to understand.
Final Step 🎉: Save your work, and there you have it! You've now created a stunning, publication-ready scientific graph!
#sciart
Looking forward to USNCTAM in Austin next week. If you are around, check out our mini symposium on nonlinear dynamics of active fluids and transition to active turbulence, with 11 talks.
#usnctam2022@ApsDsoft@DynamicsSIAM@APSphysics
Lagrangian Descriptors (https://t.co/IZOiVlLfkM) for Dynamical Systems is now available as a Python API. Huge thanks to the community of #Opensource developers @SciPyTip@ProjectJupyter@numpy_team@JOSS_TheOJ and many others for making this possible.
Just published in #JOSS_theOJ: 'LDDS: Python package for computing and visualizing Lagrangian Descriptors for Dynamical Systems' https://t.co/YwX7kUxOGR
New PhD position in #flyingsnake biomechanics at Virginia Tech, joint between my lab & @snake_flyer Project will explore fundamental fluid dynamics & control of undulating aerial locomotion, extensible to general #physics of flexible bodies in #fluids Deadline Dec 4.Please RT ad!
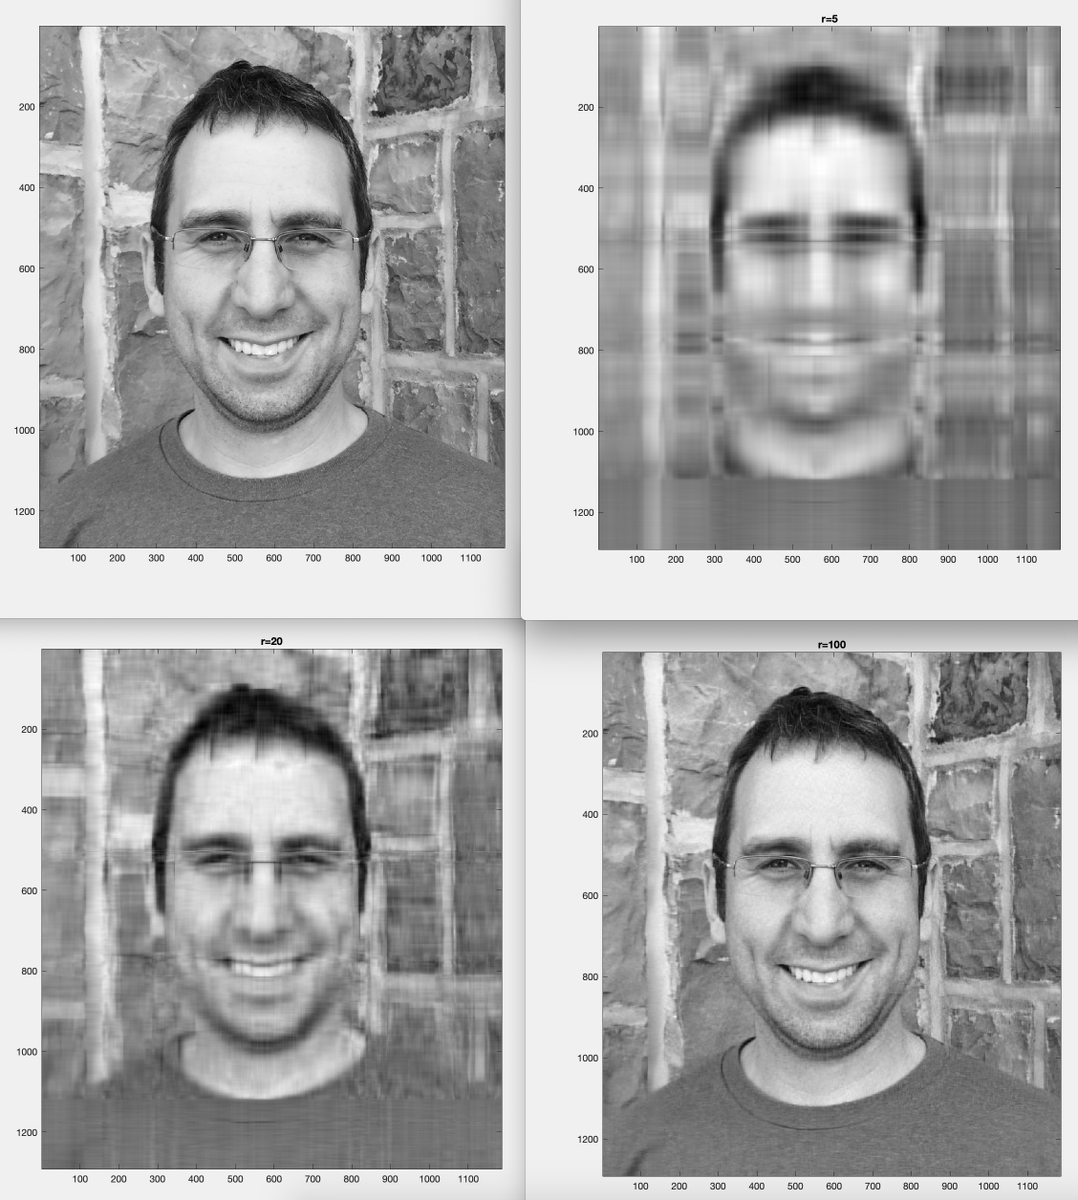
Goofing around with singular value decomposition to do some data compression of my Twitter avatar. Image at the lower right looks identical and uses only 8% of the storage !
Many thanks to @eigensteve and Mordecai the snow dog
@gknave @JavierGRocha#SVD#DataScience#Matrix
Recent work with @BristolUniMaths graduate Wenyang Lyu and Prof. Steve Wiggins explores the connection between the topography of a potential energy surface and phase space structures that govern escape dynamics (reaction or transition). https://t.co/ZlCDu5wx7O 1/
This work studies the normal form for a saddle-node Hamiltonian where the bifurcation is also related to the changes in the topography of the PES. See https://t.co/J2LLt9kW0v for more on the bifurcation. 5/
History of physics in a few sentences. Mostly this is just for lols, but it's true that the number of mysteries that physics may help shine a light on in the next 100 years is exciting.