People did incredible work to solve these problems! These examples should embolden us to solve the hard problems we face today, not make us think "oh problems aren't real". Here's a truly excellent 4 minute video on how the Ozone crisis was tackled: https://t.co/GaCVZ8LcWD
The median net worth of Canadian households soared by about 36 per cent from 2019 and 2023.
Economist’s report finds you may indeed be richer than you think. Here’s why. #Opinion https://t.co/9K7opQLle4
@corkcitylibrary Surely I am not the only person who finds this Borrowbox system a complete disaster - unwieldy, non user friendly, exasperating and with a severely limited selection compared to PressReader which was everything Borrowbox isn't. Shame CCL!!
@bindureddy’s chart on LLM evolution gives great perspective on the abundance of models starting from 2019. Important to not base any solution on only one LLM and interface.
One thing I did not expect to see from space: the world’s fishing fleets. The multicolored arrays of light on the water are fishing boats. These are only two of many hot spots – the Arabian Sea along India’s west coast, and the Gulf of Thailand and Andaman Sea, divided by Thailand and Malaysia.
After months aboard @Space_Station, @NASA astronaut @LunarLoral is scheduled to return on Apr 6. O'Hara conducted dozens of science and technology activities that benefit both space exploration and life on Earth. Read about her research in microgravity: https://t.co/uqyDRVGIJB
What ethical considerations must be taken into account when integrating AI into everyday human life, and how can we ensure responsible AI usage? https://t.co/D4ixunRquw
Evidence continues to mount that plant-based proteins can promote similar post-exercise anabolic effects as animal-based proteins. This provides additional/alternative options for muscle-building. Choice is good 💪
https://t.co/ryCoxlmmKO
Do you want to join @TheEconomist’s audience team?
We’re hiring an editor to work on social media, newsletters and other digital platforms. The position is based in New York. Applications are due by April 7th https://t.co/N2lsmy3Hkg 👇
#journojobs#audiencejournos#socialjobs
Vidalia Mills in Vidalia, Louisiana, is the first and only mill in the world to embed a unique digital tracker into its plant-based cotton fibers. https://t.co/e4VRjT68Zt
Understanding P-Values is essential for improving regression models. In 2 minutes, learn what took me 2 years to figure out.
1. The p-value: A p-value, in statistics, is a measure used to assess the strength of the evidence against a null hypothesis.
2. Null Hypothesis (H0): This is a general statement or default position that there is no relationship between two measured phenomena or no association among groups. For example, the regressor does not affect the outcome.
3. Alternative Hypothesis (H1): This is what you want to test for. It is often the opposite of the null hypothesis. For example, that the regressor does affect the outcome.
4. Calculating the p-value: The p-value for each coefficient is typically calculated using the t-test. There are several steps involved. Let's break them down.
5. Coefficient Estimate: In a regression model, you have estimates of coefficients (β) for each predictor. These coefficients represent the change in the dependent variable for a one-unit change in the predictor, holding all other predictors constant.
6. Standard Error of the Coefficient: The standard error (SE) measures the accuracy with which a sample represents a population. In regression, the SE of a coefficient estimate indicates how much variability there is in the estimate of the coefficient.
7. Test Statistic (T): The test statistic for each coefficient in a regression model is calculated by dividing the Coefficient Estimate / Standard Error of the Coefficient. This gives you a t-value.
8. Degrees of Freedom: The degrees of freedom (df) for this test are usually calculated as the number of observations minus the number of parameters being estimated (including the intercept).
9. P-Value Calculation: The p-value is then determined by comparing the calculated t-value to the t-distribution with the appropriate degrees of freedom. The area under the t-distribution curve, beyond the calculated t-value, gives the p-value.
10. Interpretation: A small p-value (usually ≤ 0.05) indicates that it is unlikely to observe such a data pattern if the null hypothesis were true, suggesting that the predictor is a significant contributor to the model.
===
Need help applying data science to business?
I'd like to help. Here's how:
👉 My Free 10 Skills Webinar: I put together a free on-demand workshop that covers the 10 skills that helped me make the transition to Data Scientist: https://t.co/LR39RJ5XKB
👉 Learn ChatGPT for 10X Faster DS Projects: I have a live workshop where I'll share how to use ChatGPT for Data Science (so you can complete projects 10X faster): https://t.co/EaMpKrJiqX
If you like this post, please reshare ♻️ it so others can get value (follow me, 🔥 Matt Dancho 🔥 for more data science concepts).
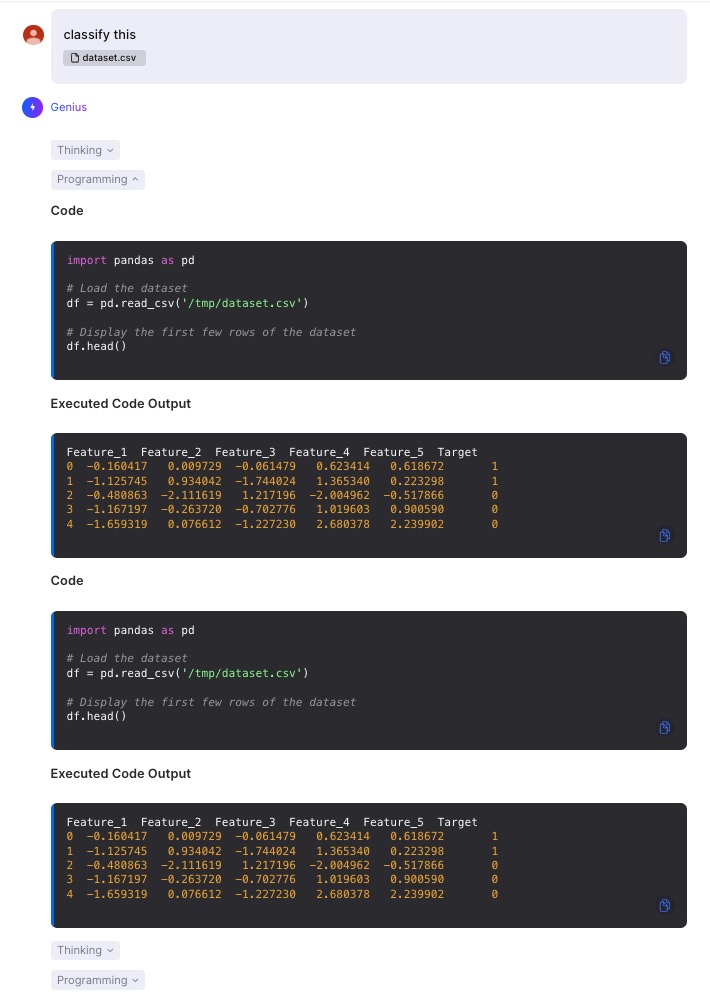
This kind of blows my mind: Imagine YOU are a data scientist, get a data file and need to build a classifier... Just tell your AI assistant to "classify this" and ... it's all DONE.
Even checks for class imbalance.