Call me crazy but I believe we are in the process of forming a major double top on Nasdaq.
Valuations don't grow to the sky and the inflation problem is far from over.
Today's weakness in megacaps despite the Fed pivot is the tell.
Call me crazy but I believe we are in the process of forming a major double top on Nasdaq.
Valuations don't grow to the sky and the inflation problem is far from over.
Today's weakness in megacaps despite the Fed pivot is the tell.
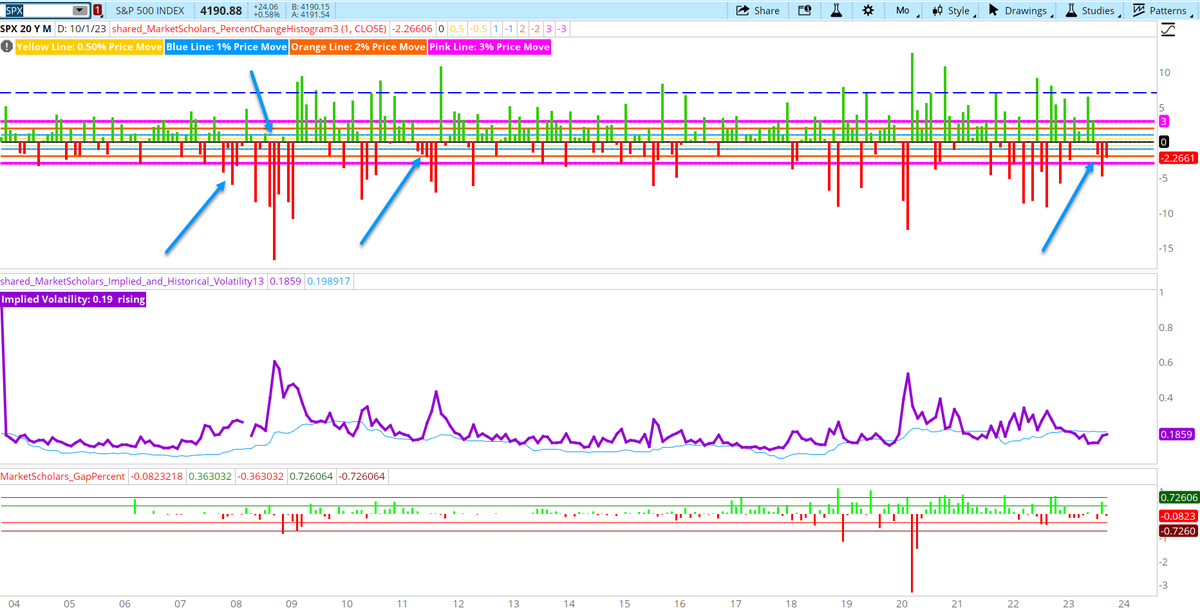
In the past 20 years, $SPX had 3 other times where it had a 3-month losing streak following a positive month. Late 2007-early 2008 (correction phase of bear market), 2008 (washout phase of bear market) and 2011 (correction). The other two corrections (similar to now) BOTH led to 5-month losing streaks
The debt-to-income ratio for all homebuyers in the US just hit 40% for the first time in history.
Even in the 2008 financial crisis, this ratio peaked at ~39%.
This comes as total household debt just hit a record $17.1 trillion and credit card debt crossed $1 trillion for the first time ever.
Consumers are borrowing at a record pace all while savings are declining and rates are rising.
What's the long-term plan here?
“Consensus is now warning that equity markets could be soft in September. But we .. expect the exact opposite .. We see S&P 500 gaining 2%-3% in September, pushing back to July highs of >4,600 ..”
@fundstrat $SPX
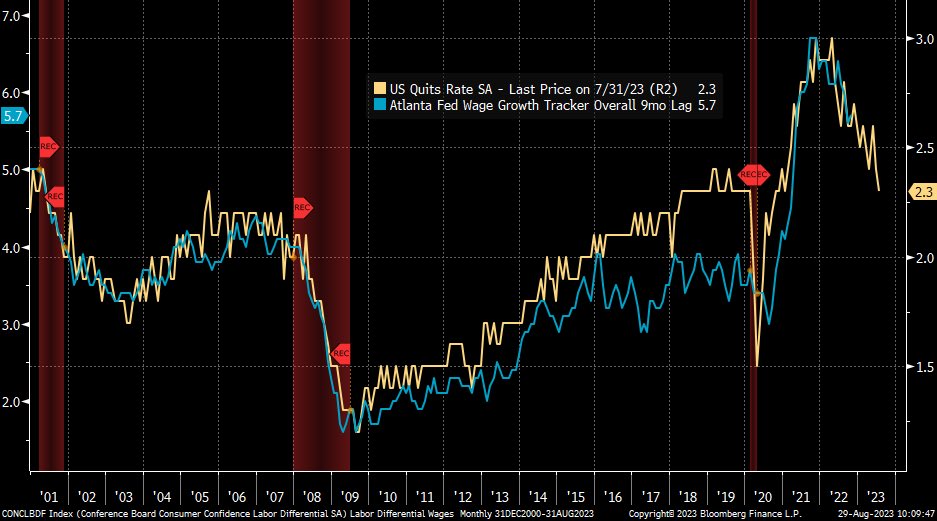
The quits rate fell to 2.3% in July and is now firmly back to the pre-pandemic baseline. This has historically led the Atlanta Fed Wage Growth Tracker by ~9mos, and suggests wage deceleration ahead.
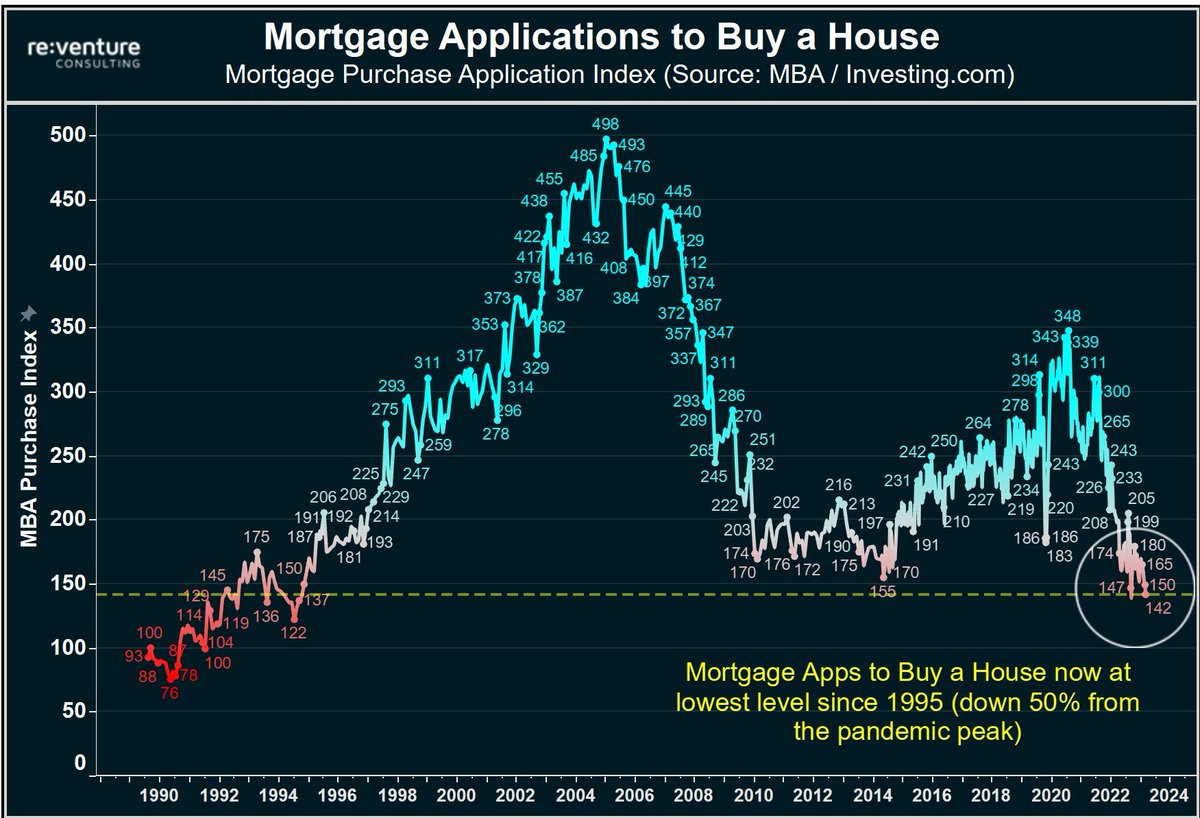
Mortgage demand is now at its lowest level since 1995 and still falling SHARPLY.
To put this in perspective, mortgage demand in 2005 was ~300% above current levels.
Since 2021, mortgage demand is down a massive 60%.
Meanwhile, existing home sales are down 16% this year, their lowest since 2010.
No one wants to sell and no one wants to buy.
Truly historic times.
We spend all week researching the top AI tools so you don't have to...
Get insights, tools, and news for free when you join our community of 40,000+ readers.
BREAKING: Median cost to buy a house hits a new record of $2,748/mo, up a MASSIVE 90% since 2020.
In other words, buying a house today costs nearly $33,000 per year.
This is 46% of the median PRE-TAX household income in the US.
Post-tax, homebuyers in the US are spending nearly 70% of their income on home payments.
Meanwhile, the median monthly apartment rent just hit a fresh record of $1,859/mo.
How has it become to difficult to have a place to live?