On October 7th, children, elderly, teenagers, parents, women and men were kidnapped, raped butchered, burnt alive in their homes and lost everything. Please help the survivors of these atrocities rebuild some of what was lost.
Feeling festive! Happy to share our new bioRxiv pre-print - investigating the role of calcium in the early embryo (with a festive themed post)
https://t.co/2D0t8iNqsY
Brush up on your knowledge of fibrous #hydrogels (FGs)! 📖
The authors discuss advantages and application fields of FGs, which have extended from in vitro cell culture environments to various domains such as the spinal cord, bones, and heart. 🦴
https://t.co/Fu6zGTW6wj
The ggnewscale package is a useful extension for ggplot2 that allows you to add multiple color and fill scales to the same plot. This means you can layer different types of data in a single graph, each with its own color scheme, without conflicts.
✔️ Multiple Scales on One Plot: ggnewscale makes it possible to use separate color or fill scales for different plot layers, giving you greater flexibility when combining multiple data sets.
✔️ Enhanced Data Layering: Ideal for cases where you need to show different types of data (e.g., points and lines) with distinct visual styles in one plot.
✔️ Easy to Implement: Works seamlessly with ggplot2, and integrating it into your existing code is straightforward.
If you want to combine different data layers into a single, cohesive visualization, ggnewscale helps you achieve this without sacrificing clarity. The example visualization shown here is taken from the package website: https://t.co/AJpF87pHPF
Want to take your data visualizations to the next level? Sign up for my online course, Data Visualization in R Using ggplot2 & Friends, starting on November 25, 2024, where we cover ggplot2 and its advanced extensions in depth. Check out this link for more details: https://t.co/ztlEzoEDWv
#Statistical #DataViz #tidyverse #coding #RStats #datavis
#WeekendRead! #MicrobiotaPower! Anderson @kodiravi &co show @cellhostmicrobe that caspases of apoptotic #intestinal epithelial cells during chemotherapies drive purine-containing metabolites rewiring E Coli metabolism, driving dysbiosis & delaying #repair! https://t.co/VCqPczsopS
The ggh4x package is an extension for ggplot2 that enhances the flexibility of creating complex and customizable visualizations. It adds extra functionality, allowing users to build more sophisticated plots with less effort.
Opportunities and advantages of using ggh4x include:
✔️ Facilitates Nested Facets: Create multi-level facet grids, making it easier to display intricate data relationships.
✔️ Custom Axis Adjustments: Offers better control over axis positioning, scaling, and labeling, allowing for a cleaner and more intuitive presentation.
✔️ Advanced Themes and Guide Enhancements: Provides more options for arranging plot elements, including fine-tuning themes and customizing guides like legends and scales.
✔️ Smooth Integration with ggplot2: Works seamlessly with existing ggplot2 plots, so you don’t need to change your workflow to add these advanced features.
Overall, ggh4x is ideal for data scientists and analysts who need to present complex data sets effectively without spending too much time on manual adjustments.
The visualization shown here is an example taken from the ggh4x package website: https://t.co/7FgUqnF5wv
If you’d like to learn more about data visualization in R, including how to make the most of ggplot2 and its extension packages, check out my online course on "Data Visualization in R Using ggplot2 & Friends," starting on November 25, 2024. Take a look here for more details: https://t.co/ztlEzoFbM3
#ggplot2 #RStats #datascienceeducation #datastructure #datasciencetraining #DataAnalytics #DataViz
Excited to share our latest work! We developed a new method for studying RNA localization via proximity labeling: OINC-seq! In contrast to other proximity methods, labels deposited on RNAs are read directly by sequencing without a need for biotinylation. https://t.co/SPvrMuw4ld
New paper out! 🚨 We show that vampire bats use amino acids from a recent blood meal to fuel RUNNING - a rare mode of locomotion in bats ideal for stalking prey. I’d worry less about your neck and more about your ankles! 🧛🏻♂️ @WelchLab_UTSC@RSocPublishing
https://t.co/4H5dg7TsNK
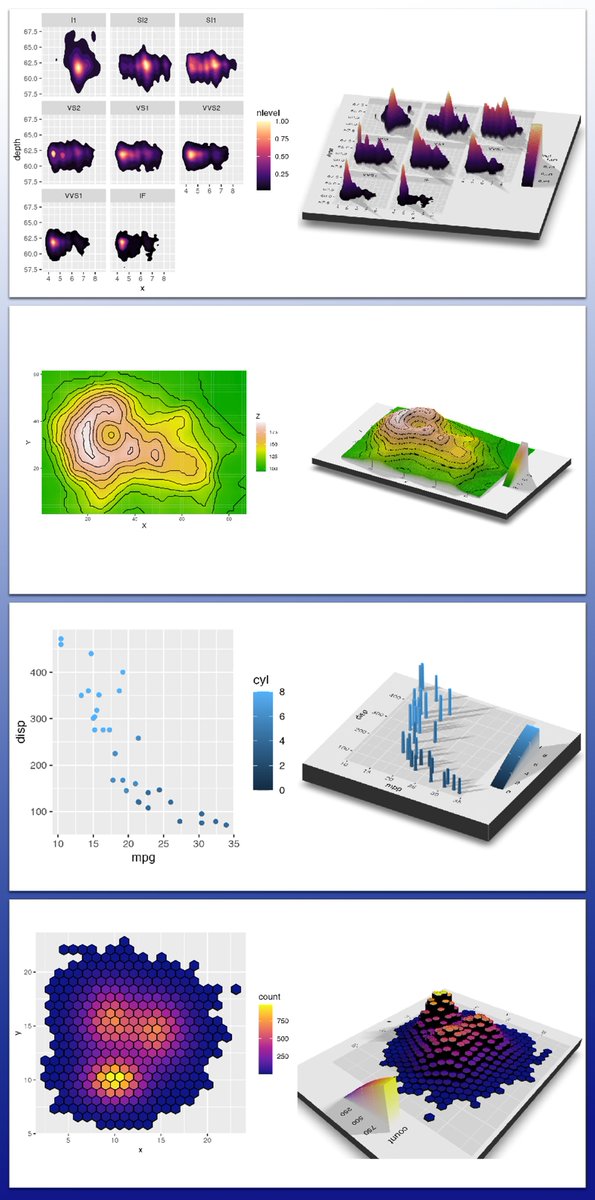
Bring your ggplot2 visualizations into 3D with rayshader! This extension adds powerful 3D plotting capabilities to R, making it easy to transform standard visuals into interactive and visually engaging data representations.
With rayshader, you can:
✔️ Add Interactive 3D Effects – Customizable lighting and shadows bring new depth to your data.
✔️ Enhance a Range of Data Sets – Apply 3D effects to bar charts, heatmaps, and more.
✔️ Boost Audience Engagement – Present data in an appealing, informative 3D format.
The visualizations shown here are taken from the rayshader package website: https://t.co/BMQdE1DZH7
For more on ggplot2 and its powerful extensions, join my course “Data Visualization in R Using ggplot2 & Friends,” starting November 25, 2024. An early bird deal is live until November 6.
Further details: https://t.co/ztlEzoEDWv
#DataVisualization #Statistical #programmer #VisualAnalytics #database
I am so glad the Gut Analysis Toolbox manuscript proofs are done @J_Cell_Sci. Just wanted to acknowledge critical feedback from reviewers that helped improve the software and manuscript immensely. The peer review history is published with the article: https://t.co/ddc6KULms7
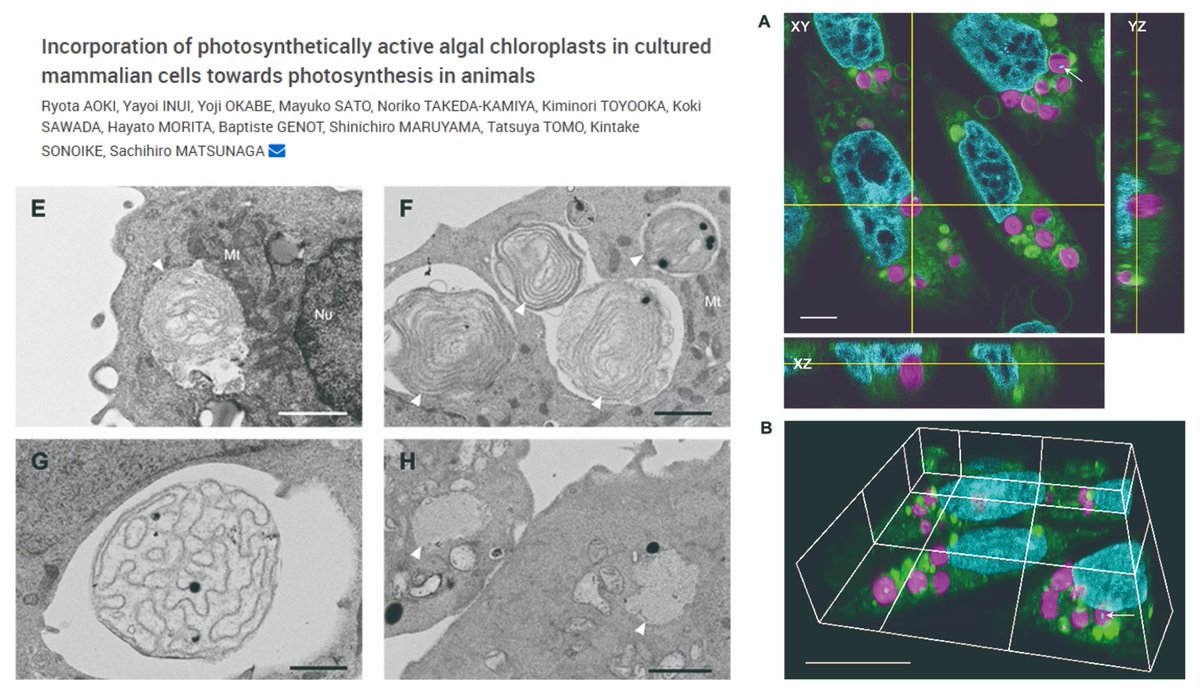
Photosynthetic Mammalian cells!😆
#Chloroplast (red alga C. merolae) transplant into CHO-K1 cells (2:1 coculture)
Uptake observed in 20% cells; Some have 7~45 chloroplasts
Photosynthesis in cultured cells persists at a level similar to isolated chloroplasts for 2 days!
Sachihiro Matsunaga lab Proc Jpn Acad Ser B Phys Biol Sci 2024
https://t.co/AfkyUqrqXc
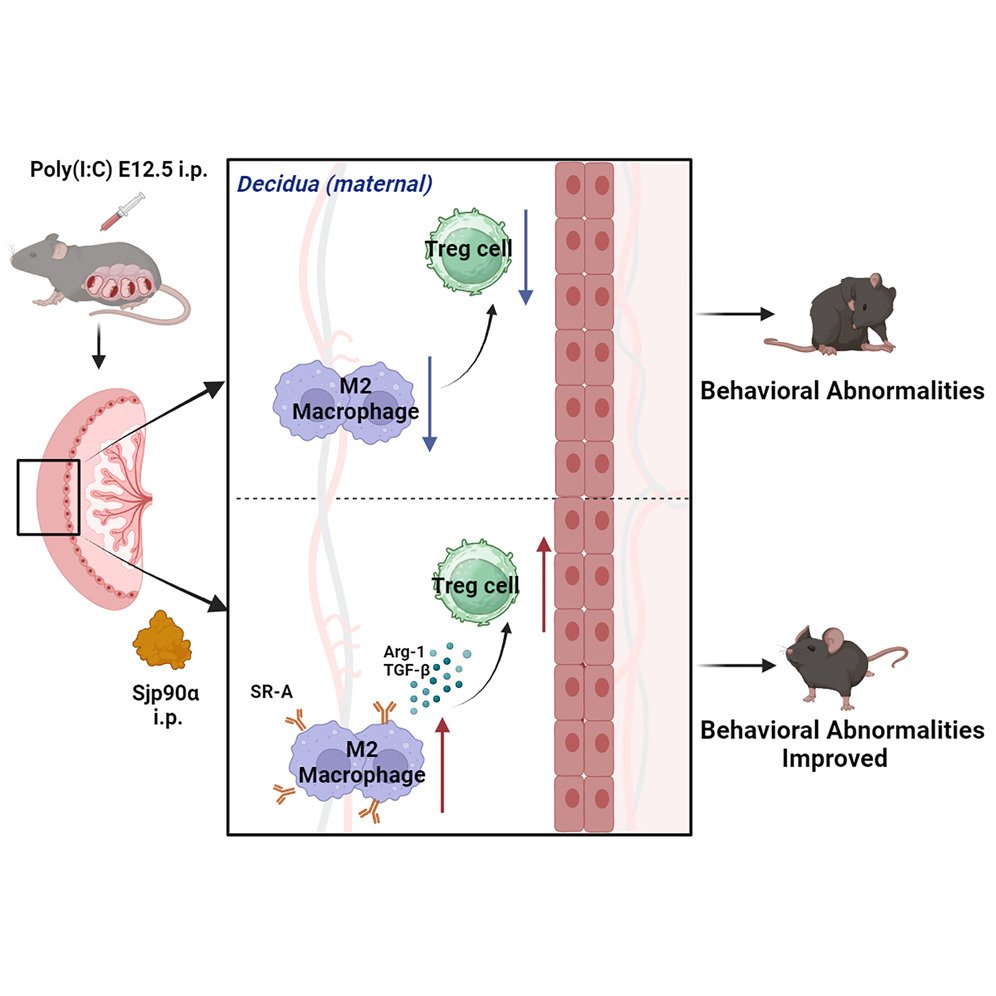
The rebalancing of the immune system at the maternal-fetal interface ameliorates autism-like behavior in adult offspring. @CellReports https://t.co/Se87oiePGI
⚠️Here’s yet another option other than BioRender! ⚠️
📢 SciDraw is a free repository of high quality drawings of animals, scientific setups, and anything that might be useful for scientific presentations and posters.
🔁❤️Free Science! RIP BioRender!!
🚨 Super psyched this story is finally out!
Herculean effort and 3rd chef d’oeuvre in @NatCellBio by @patriziaromani in just 5y, where we describe #mitochondrial#mechanotransduction.
https://t.co/l9oRSFdhaH
Megathread with bonuses ⬇︎⬇︎⬇︎
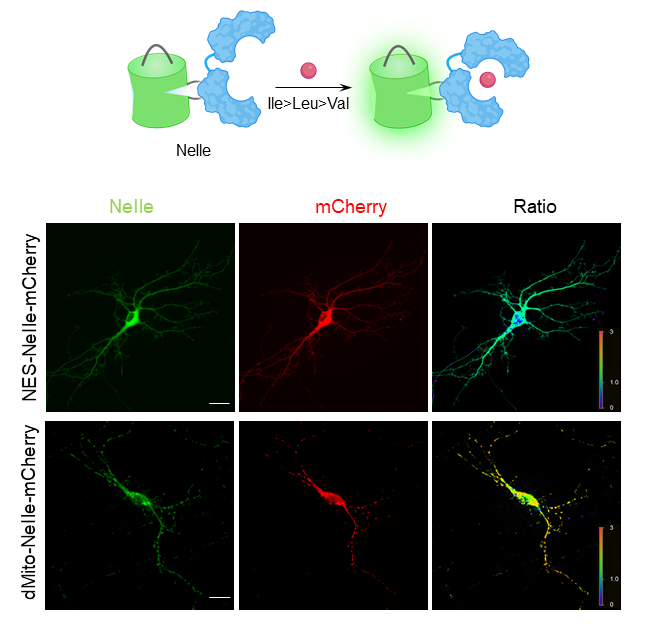
Using our new green biosensor, named NeIle, we revealed that the concentration of BCAA in mitochondria is higher than in the cytoplasm of neurons (https://t.co/nZoakaNNUh). The plasmids are available for free from WeKwikGene https://t.co/czZn4IWjJA
We are excited to share our work from @galloway_lab with the amazing help of @xstephtsai Daniel Montoro, @DrMihoTanaka @dingwallaby, @BenRFreedman, and others. "A latent Axin2+/Scx+ progenitor pool is the central organizer of tendon healing"
@Nature_NPJ : https://t.co/vUmkiXW2Sz
Thrilled to share the most comprehensive Atlas of Proteome/Phosphoproteome Turnover across mouse tissues and brain regions, thanks to the outstanding @Yanshen73854711 & @JunminPengLab! Proud to contribute to this. Check it out: #Proteomics#ProteinTurnover https://t.co/2iFE2LyIpN
Hot off the press from the @galloway_lab! 🌶️
A @harvardstemcell team identified a specialized #quiescent Scx+/Axin2+ cell population in mouse and human tendons that initiated healing and was a major functional contributor to repair.
💬 @Nature_NPJ: https://t.co/E7qsptc0tz