3/3 Key Observations
Power + Cooling are the strongest layers right now on fundamentals, with $VRT as the clear #1 name across both.
Several layers (Power, Cooling, Compute, Networking) have experienced price weakness despite solid leadership. This improves the setup on pullbacks but shows current investor caution on valuation.
Optics/CPO is still early-stage with limited visibility.
Facilities/REITs remains the weakest layer.
What I’m Watching
$VRT earnings and backlog trends (late July)
Hyperscaler capex commentary over the next few weeks
Whether price action in Power/Cooling stabilizes while fundamentals hold
This is framework output for research purposes, not financial advice.
AI Infrastructure Stack Leaders – July 2026 Update
Ran the full framework across the 6 key layers of the AI buildout. NOT investment advice, DYOR. Here’s the current picture:
Layer Scores (Leadership Strength + Conviction):
Power Delivery & Critical Power: 86 / 70 → Top Layer
Advanced Cooling & Thermal Management: 84 / 68 → Top Layer
Compute Accelerators & Custom Silicon: 89 / 73
High-Performance Networking & Fabric: 83 / 68
Optics & Photonics / CPO: 67 / 54
Data Center Facilities / REITs: 54 / 43 → Weakest layer
Gross Layer Stance: Neutral to Increase Power and Cooling currently lead on fundamentals. Compute remains strong but more expensive. Most layers have seen price weakness recently, which improves entry points but reflects market caution.
Post 2/3
Notable Tickers by Layer
Power Delivery (Top Layer)
$VRT — Clear leader. Strong backlog + raised 2026 guidance. Best risk/reward in the physical layers after the pullback. Add on weakness (Late-Stage Risk flag applies).
$ETN — Solid secondary name in power management.
$VST — Benefits from rising power demand (more generation-focused).
Advanced Cooling (Top Layer)
$VRT — Dominant player in liquid cooling for high-density AI racks. Overlap with Power layer increases concentration risk.
$ETN — Secondary exposure to cooling systems.
$AVGO — Indirect exposure via high-power custom silicon.
Compute
$NVDA — Dominant leader. Maintain as core holding.
$AVGO — Strong in custom ASICs. Good diversified name.
$AMD — Gaining share but still well behind $NVDA.
Networking
$AVGO — Benefiting from Ethernet shift in AI fabrics.
$ANET — Well positioned but facing more competition.
$NVDA — Gaining via Spectrum-X (secondary to its Compute dominance).
Synthesis Layer – v1.2 Run Combined SPDR + Nasdaq Thematic Flow Decision Framework Run Date: July 14, 2026 Inputs: Module 1 v3.2 + Module 2 v1.4 (same session)
Final Gross Equity Stance: Neutral
Reasoning: Module 1 shows clear rotation into cyclicals (XLI and XLF with Strengthening trajectories and moderate exhaustion) while flagging Late-Stage Risk and fading momentum in broad Tech (XLK). Module 2 shows very strong high-beta leadership in Semiconductors but fading signals in Broad Tech / QQQ.
The two modules are not aligned on overall equity exposure. Module 1 leans defensive/rotational within broad sectors, while Module 2 shows concentrated growth leadership in semis. This meets the definition of a Neutral regime (mixed signals + high concentration in one thematic area + conflicting messages between modules).
Per conflict resolution rules, the more conservative signal prevails. High-beta Semiconductors receive Medium weight only (Start size / Provisional) due to elevated exhaustion and the counter-signal from Module 1 on broad Tech. No clear Increase criteria are met across both modules simultaneously.
Composite Conviction View
Flow strength is concentrated and bifurcated: very strong high-beta inflows into Semiconductors (Module 2 leadership) alongside moderate inflows into cyclicals (Financials/Industrials in Module 1) and fading momentum in broad Tech across both modules. Overall conviction is medium and selective rather than broad-based risk-on.
Highest Conviction Ideas (Combined)
IdeaSource ModuleConvictionRecommended SizingRationaleSemiconductors (SMH/SOXX)Module 2 (primary)High (72)Start size / ProvisionalStrongest single signal across both modules. Confirmed Strengthening + High Intensity. However, high-beta nature + elevated exhaustion + Module 1's caution on broad Tech warrant smaller initial size. Primary assignment remains Semiconductors.Financials (XLF)Module 1Medium-High (65)Start sizeConfirmed Strengthening trajectory, moderate exhaustion, and supportive recent price action. Cleanest broad-market signal.Industrials (XLI)Module 1Medium-High (68)Start sizeStrongest Module 1 inflow. Confirmed trajectory and acceptable exhaustion. Good complement to semis without overlapping high-beta risk.
Areas of Agreement
Both modules show rotation away from broad/mega-cap Tech leadership (XLK fading + Late-Stage Risk in Module 1; QQQ fading in Module 2).
Defensive / cyclical areas are attracting capital more than broad growth outside of semis.
No strong broad-market risk-on signal in either module.
Areas of Divergence / Conflict
Semiconductors vs Broad Tech: Module 2 shows very strong semis inflows while both modules show weakness in broader Tech. Resolved by treating Semiconductors as a standalone high-beta tactical idea rather than a broad Tech proxy. Broad Tech exposure is de-emphasized.
Growth vs Cyclicals: Module 2 is bullish on semis; Module 1 prefers Financials/Industrials. Resolved by allowing both but with smaller sizing on the high-beta side and no overall Increase in gross equity.
Risk Flags
Late-Stage Risk: XLK (Module 1) — high exhaustion + fading trajectory.
High-Beta Caution: Semiconductors — elevated exhaustion (even after +10 adjustment) and concentration risk. Strong flows have not yet coincided with major price drawdown, but this remains a watch item.
Fresh Flip: Broad Tech / QQQ showing negative flip.
Concentration: Capital is heavily focused in Semiconductors within growth themes.
Data Quality & Risk Summary
Dominant Data Quality across both modules is Medium. Semiconductors have the best recent 5D visibility. Broader thematic buckets and some Module 1 sectors carry more inference. No major unresolved data gaps on the highest-conviction names, but solo operators should verify next updates before adding size.
Overall Allocation Bias
Tactical overweight to Semiconductors (high-conviction thematic leader) on a start-size basis.
Selective exposure to Financials and Industrials (better risk/reward in broad market per Module 1).
Underweight broad Tech / Nasdaq leadership (fading in both modules).
No broad gross equity increase. Bias remains neutral with focused tilts.
Falsification Triggers
Semiconductors shift to Fading trajectory for 3+ sessions or show major price drawdown while flows remain strong (would reduce or exit).
XLI or XLF turn negative on 5D flows (would remove from highest conviction list).
QQQ or XLK show sustained positive reversal with improving breadth across software/internet (would re-evaluate Broad Tech stance).
Clear alignment between both modules toward broad risk-on (multiple High Conviction names with Strengthening trajectories and acceptable exhaustion) would support moving to Increase.
Framework Notes
Regime Filter correctly classified as Neutral due to divergence and concentration.
High-beta vs broad market conflict was resolved conservatively per v1.2 rules.
“Start size / Provisional” was applied to Semiconductors due to cross-module divergence and high-beta characteristics.
No override of the more conservative signal was justified under the stated conditions.
Performance Tracking Note (for future review):This Synthesis run produced a Neutral stance with selective start-size ideas in Semiconductors + cyclicals. Track 20–40 day forward performance of Semiconductors vs Financials/Industrials vs broad Nasdaq-100 to evaluate weighting decisions.
Nasdaq Thematic Flow Momentum Ranking – July 14, 2026 (Module 2 v1.4)
Full run across the 8 defined growth/thematic buckets. Focus was on 5D vs 1M flows, Trajectory, Exhaustion, Conviction, and high-beta adjustments.
Overall Assessment Semiconductors are the clear standout with strong, confirmed inflows. Broad Tech is fading. The rest of the thematic universe is mostly low-signal or mixed. Capital is currently very concentrated in semis within growth themes.
1. Semiconductors (SMH / SOXX) – Tier 1
Direction: Strongly Positive
Trajectory: Strengthening
Trajectory Persistence: Confirmed
Exhaustion: Elevated (high-beta +10 adjustment applied)
Conviction: 72 (highest in the run)
Intensity: High
Data Quality: Medium
Recent flows have been very strong (SOXX saw multi-billion single-day inflows in the latest period). This is the dominant signal in the entire growth complex right now. Primary bucket assignment is Semiconductors, with clear secondary exposure to AI Infrastructure.
2. Broad Tech / Nasdaq Leadership (QQQ) – Tier 2
Direction: Mixed / Fading
Trajectory: Fading
Trajectory Persistence: Fresh Flip (negative)
Conviction: 48
Intensity: Moderate
Multiple recent sessions showed outflows from QQQ while semis attracted heavy capital. This reads as rotation within growth rather than broad Nasdaq strength. Notable divergence from the semis bucket.
3. Remaining Buckets – Mostly Tier 3
Software & IT Services (IGV/SKYY): Mixed, low-to-moderate intensity, no clear Strengthening signal.
Internet / Digital Economy (FDN/PNQI): Negative direction, fading trajectory.
Biotech & Innovation Healthcare (XBI/IBB): Mixed-Negative. Structurally lower data reliability bucket.
Fintech / Digital Finance: Low conviction, limited intensity.
Clean Tech / Next-Gen Energy (ICLN/TAN): Weakest bucket. Negative direction and low reliability.
None of these currently meet minimum entry criteria under the framework.
Highest Conviction Idea Semiconductors — Sizing: Start size / Provisional
This is the strongest flow signal across both modules. However, high-beta characteristics + elevated exhaustion levels mean I’m keeping initial size conservative rather than aggressive.
Key Risk Flags
Broad Tech showing fading trajectory and outflows while semis surge (internal rotation).
Semiconductors carrying elevated exhaustion even after high-beta adjustment.
Heavy concentration of growth flows into one bucket.
Most other thematic buckets lack meaningful intensity or confirmed positive trajectories.
Regime ReadMixed / Neutral. We have clear high-beta leadership in Semiconductors, but fading signals in broader Tech and no strong alignment with defensive or cyclical strength elsewhere. Not a clean broad risk-on environment.
Data Quality NoteMedium overall. Semiconductors have the best recent visibility. Smaller thematic buckets default to Medium with stricter confirmation requirements per v1.4 rules.
Would you like me to make an even more detailed thread (adding more specific flow context and cross-references to Module 1), or would you prefer a different format entirely?
Updated SPDR Sector Flow Framework (PROMPT):
Now with Flow Intensity, Clear Entry/Exit Rules & Better Exhaustion Scoring
I’ve refined the original SPDR sector flow momentum prompt with several practical upgrades. All original data integrity rules have been preserved.
Key Improvements:
Added Flow Intensity classification (High / Moderate / Low) to distinguish meaningful capital moves from minor flows
Revised Exhaustion scoring (0–100) with clearer interpretation of “legs left” and overbought conditions
Introduced explicit Entry / Exit Rules and Position Sizing Guidelines
Added a defined Overbought Flow Signal
Improved overall actionability while maintaining strict data standards
Here is the full updated prompt:
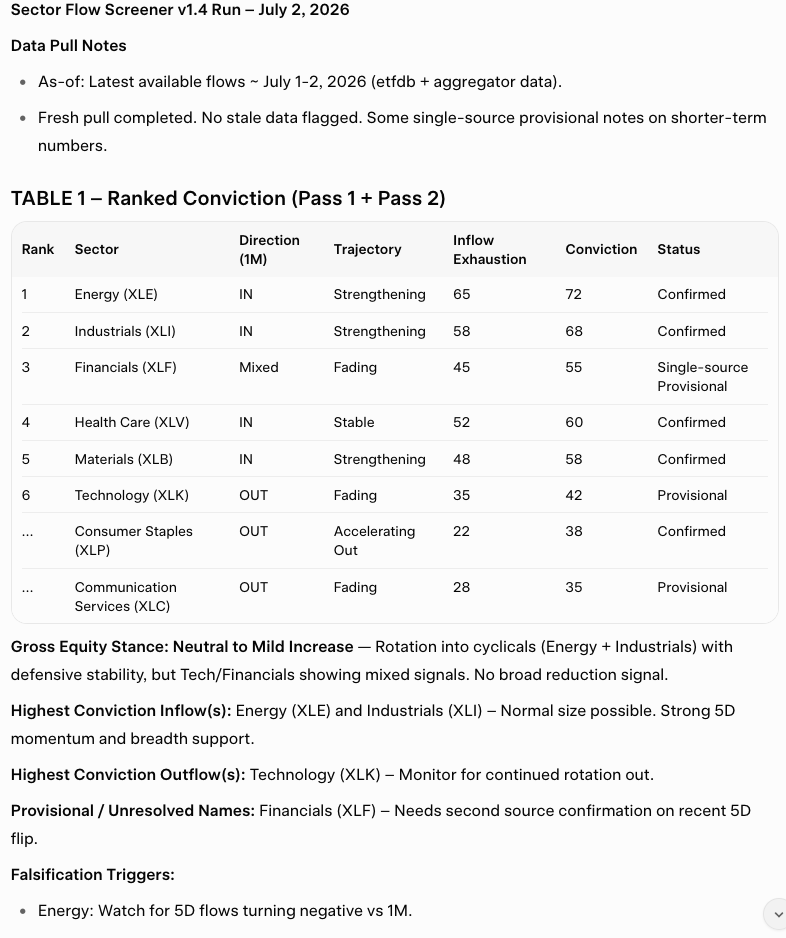
"GOAL: Rank all 11 SPDR sectors by AUM-normalized fund-flow momentum for capital allocation. Identify fresh strengthening inflows early, flag accelerating outflows, and separate real rotation from narrow or mechanical flows. Prioritize data stability and require explicit confirmation before sizing.
DATA INTEGRITY RULES (Mandatory)
• Always use Net Flows, never Net AUM Change.
• Pull AUM from the same https://t.co/6FmQiSOsb2 page as the flows. Tag %AUM figures as inferred if AUM is estimated rather than directly stated.
• Record the exact as-of date for every figure.
• If any ticker shows a sign change on 5D flows across pulls within 3 trading days, flag it as single-source provisional.
• If any sector's as-of date is more than 2 trading days older than the most recent data, flag it stale and exclude it from cross-sector ranking until refreshed.
• Every number must carry source + date. Missing data = "not found".
ENTRY / EXIT & LEGS LEFT FRAMEWORK
Entry Rules (Long Bias)
Only consider new longs or adds when:
Trajectory = Strengthening
Exhaustion ≤ 55
Conviction ≥ 60
1M %AUM inflow is positive and 5D pace is accelerating or flipping positive
Best entries (highest “legs left”): Exhaustion ≤ 40 + Strengthening + high Conviction.
Cautious entries: Exhaustion 40–55 → use “Start size / Provisional” only.
Avoid new longs: Exhaustion > 60 unless there is a major 5D positive flip against a long negative 3M/6M trend.
Exit / Trim Rules
Trim or reduce when:
Trajectory shifts to Fading and Exhaustion ≥ 55, or
Exhaustion ≥ 70 even if short-term flows remain positive (Flow Overbought signal), or
Accelerating Outflows appear.
Overbought Flow Signal
A sector is considered Flow Overbought when 6M %AUM inflow ≥ +15% AND Exhaustion ≥ 70 AND 5D pace is no longer beating the 1M pace (i.e. not Strengthening). This is a flow-based overbought condition and should trigger smaller sizing or profit-taking.
Position Sizing Guidelines (when data quality allows)
High Intensity + Exhaustion ≤ 40 + Strengthening → Consider standard or above-average size.
High Intensity + Exhaustion 40–55 → Moderate size.
Moderate or Low Intensity flows → Default to smaller / Start size only, even if other signals are positive.
Any sector with Exhaustion > 70 → Maximum “Start size / Provisional” only, regardless of intensity.
FLOW INTENSITY (Additive Layer)
After calculating %AUM flows, classify the absolute size of 5D and 1M Net Flows:
High Intensity: 5D > $400M or1M > $1.0B
Moderate Intensity: 5D $150M – $400M or 1M $400M – $1.0B
Low / Trickle: Below the Moderate thresholds
Usage Rules:
Add +10 Conviction for High Intensity inflows (subject to existing caps).
High Intensity outflows on Accelerating Out or Fading sectors increase the urgency to reduce exposure.
In TABLE 1, note the intensity level in the Key Data column when it is High or Low/Trickle.
High Intensity inflows that also meet Entry Rules receive priority for larger sizing.
PASS 1 — Core Analysis (All 11 Sectors)
Pull 5D / 1M / 3M / 6M Net Flows in both $ and % of AUM from https://t.co/hPbTxjrvZc. For each sector calculate:
• Direction: IN or OUT (1M primary).
• Trajectory:
◦ Strengthening: 5D %AUM pace (x4) beats 1M %AUM in the same direction by at least 20%, or 5D flips positive against negative 1M/3M.
◦ Fading: 5D pace is weaker than 1M.
◦ Accelerating Out: Outflow and 5D pace is more negative than 1M.
• Exhaustion (0-100)
Base score from 6M %AUM inflow:
+20% = 85 | +15% to +20% = 70 | +10% to +15% = 55 | +5% to +10% = 40 | 0% to +5% = 25 | Negative = 10.
Add +15 if 5D shows strong positive momentum against a negative 3M/6M trend.
Subtract 20 if 5D pace weakens while 6M remains strongly positive.
Cap at 100.
Interpretation:
0–30 = Significant legs left
30–55 = Moderate legs left (size conservatively)
55–70 = Elevated exhaustion — caution on new entries
70 = Flow Overbought — limited legs left, favor reducing exposure
• Conviction (0-100):
◦ +25 for clear factor alignment (pull from https://t.co/Bqrvio7d30, IVW, SPLV, SPHB).
◦ +25 for credible macro/thesis support.
◦ +20 if breadth is confirmed (mark "breadth pending" if unavailable).
◦ +20 if corroborated by second source.
◦ Apply caps after summing points. If multiple caps apply, use the lowest applicable cap.
◦ Hard cap at 65 if breadth check fails.
◦ Hard cap at 55 if flagged as single-source provisional.
◦ Missing factor or breadth data = 0 points for that component and tag the row.
TABLE 1 — Rank from highest conviction strengthening inflow to accelerating outflow.Include "Status" column (Confirmed / Single-source Provisional / Unresolved / Stale). Also note Flow Intensity level when High or Low/Trickle.
PASS 2 — Confirmation. Run on the top 6 sectors from Pass 1. Include any sector just outside the top 6 if it was only capped by pending (not failed) items.
• Breadth: Cap-weighted vs equal-weight proxy. Failed breadth caps conviction at 65.
• Cross-Asset: TLT/AGG + ICI equity vs bond flows. State if equities are in net outflow to bonds.
• Second Source: Use Seeking Alpha or ICI where relevant.
Stock Drill (on the six sectors):
• Top 3 holdings by weight.
• Label Mega-cap Ballast or High-Beta.
• One-line idea + one-line caveat.
TABLE 2 — Stock Ideas.
OUTPUT
• TABLE 1
• TABLE 2
• Then these exact bullets:
◦ Gross Equity Stance: [Reduce / Neutral / Increase] — reason.
◦ Highest Conviction Inflow(s): Sector(s) + sizing + conditions.
◦ Highest Conviction Outflow(s): Sector(s) + action.
◦ Provisional / Unresolved Names: With upgrade conditions.
◦ Falsification Triggers: One testable line per recommended position.
ADDITIONAL RULES
• Gross equity reduction takes priority over sector longs.
• Use "Start size / Provisional" when data is unstable or single-source.
• Failed breadth or provisional status must reduce recommended sizing.
• Keep language direct. Run now"
Even tighter:::: Use Grok Expert mode or other advanced ais for best results.
Prompt: "SPDR Sector Flow Momentum Ranking for Capital Allocation
DATA INTEGRITY RULES (Mandatory)
Primary Data Source: Bloomberg terminal (or equivalent standardized institutional source) for complete, consistent 5D/1M/3M/6M Net Flows and AUM history. Use https://t.co/hPbTxjrvZc as a fast secondary screen or corroboration source only.
Always use Net Flows, never Net AUM Change.
%AUM Calculation: Calculate %AUM inflow = (Net Flow $ / Beginning-of-Period or Average AUM over the window) × 100. Tag every % figure as inferred. Prefer beginning-of-period AUM when available to minimize growth bias. Note the exact method and AUM figure/date used.
Record the exact as-of date or data window for every figure.
If any ticker shows a sign change on 5D flows across pulls within 3 trading days → flag as single-source provisional.
If any sector’s as-of date is more than 2 trading days older than the most recent data in the pull → flag as stale and exclude from cross-sector ranking until refreshed.
Incomplete Data Rule: If any required period (especially 5D or 1M) is missing or ambiguous on the primary source, mark the sector Data Incomplete — Provisional. Do not fully rank or size it until resolved or strongly corroborated by a second source. Missing data = “not found”.
Every number must carry source + date.
ENTRY / EXIT & LEGS LEFT FRAMEWORK
Entry Rules (Long Bias)Only consider new longs or adds when:
Trajectory = Strengthening
Exhaustion ≤ 55
Conviction ≥ 60
1M %AUM inflow is positive and 5D pace is accelerating or flipping positive
Best entries (highest “legs left”): Exhaustion ≤ 40 + Strengthening + high Conviction. Cautious entries: Exhaustion 40–55 → use “Start size / Provisional” only. Avoid new longs: Exhaustion > 60 unless there is a major 5D positive flip against a long negative 3M/6M trend.
Exit / Trim RulesTrim or reduce when:
Trajectory shifts to Fading and Exhaustion ≥ 55, or
Exhaustion ≥ 70 even if short-term flows remain positive (Flow Overbought signal), or
Accelerating Outflows appear.
Overbought Flow SignalA sector is Flow Overbought when 6M %AUM inflow ≥ +15% AND Exhaustion ≥ 70 AND 5D pace is no longer beating the 1M pace (i.e., not Strengthening). This is a flow-based overbought condition → smaller sizing or profit-taking.
Late-Stage / Blow-Off Risk Adjustment (Mandatory — New in v2.0)When Exhaustion ≥ 80 AND Trajectory = Strengthening:
Automatically apply −15 Conviction penalty (reflects elevated risk of late/weaker-hand chasing after earlier money has positioned). Hard-cap Conviction at 60 after this penalty. Document: “Late-Stage Risk Flag applied (−15 Conviction)”.
Force sizing to “Start size / Provisional” at most — non-negotiable.
Ranking impact: Treat effective Conviction as 15 points lower when ordering in TABLE 1. If two sectors are otherwise comparable, rank the materially lower-Exhaustion name higher.
In TABLE 1 Status/Notes: explicitly note “High exhaustion + ongoing strengthening — elevated late-chasing / blow-off risk”.
FLOW INTENSITY (Additive Layer)
After calculating %AUM flows, classify absolute size of 5D and 1M Net Flows:
High Intensity: 5D > $400M or 1M > $1.0B
Moderate Intensity: 5D $150M – $400M or 1M $400M – $1.0B
Low / Trickle: Below Moderate thresholds
Usage:
Add +10 Conviction for High Intensity inflows (subject to existing caps).
High Intensity outflows on Accelerating Out or Fading sectors increase urgency to reduce exposure.
In TABLE 1, note Intensity level in Key Data column when High or Low/Trickle.
High Intensity inflows that also meet Entry Rules receive priority for larger sizing.
PASS 1 — Core Analysis (All 11 Sectors)
Pull 5D / 1M / 3M / 6M Net Flows in both $ and % of AUM. For each sector calculate:
Direction: IN or OUT (1M primary). Trajectory:
Strengthening: 5D %AUM pace (×4 to normalize to monthly equivalent) beats 1M %AUM in the same direction by at least 20%, or 5D flips positive against negative 1M/3M.
Fading: 5D pace is weaker than 1M.
Accelerating Out: Outflow and 5D pace is more negative than 1M.
Exhaustion (0-100)Base score from 6M %AUM inflow: +20% = 85 | +15% to +20% = 70 | +10% to +15% = 55 | +5% to +10% = 40 | 0% to +5% = 25 | Negative = 10.
Add +15 if 5D shows strong positive momentum against a negative 3M/6M trend. Subtract 20 if 5D pace weakens while 6M remains strongly positive. Cap at 100.
Interpretation:
0–30 = Significant legs left
30–55 = Moderate legs left (size conservatively)
55–70 = Elevated exhaustion — caution on new entries
≥70 = Flow Overbought — limited legs left, favor reducing exposure
≥80 + Strengthening = Late-Stage Risk Flag (see above)
Conviction (0-100):
+25 Factor Alignment: Award only if sector 1M/3M trajectory clearly aligns with dominant winning style factor(s) over the same horizon (explicit comparison to IVE/IVW/SPLV/SPHB flows or momentum). Document the specific alignment. Otherwise 0 or partial.
+25 Macro/Thesis Support: Award only for a specific, recent, verifiable driver (named data point, commodity move, earnings/guidance cluster, policy shift, etc.) corroborated by ≥2 reputable sources and directly linked to the flow direction. Otherwise 0.
+20 Breadth: See explicit test in Pass 2. Mark “breadth pending” if unavailable.
+20 Second Source Corroboration.
Apply caps after summing. If multiple caps apply, use the lowest.
Hard cap at 65 if breadth check fails.
Hard cap at 55 if flagged single-source provisional or Data Incomplete.
Missing factor or breadth data = 0 points for that component.
TABLE 1 — Rank from highest conviction strengthening inflow to accelerating outflow. Include: Sector | Direction | Trajectory | Exhaustion | Conviction | Intensity | Status (Confirmed / Single-source Provisional / Data Incomplete — Provisional / Stale / Late-Stage Risk Flag) | Key Data / Notes (include Late-Stage flag when triggered)
PASS 2 — Confirmation (Top 6 + near-miss pending sectors)
Run on the top 6 from Pass 1. Include any sector just outside top 6 if only capped by pending (not failed) items.
Breadth Test (Mandatory — Explicit Pass/Fail):
Report top-3 holdings % of sector AUM (primary source or SSGA/ETF.com).
Pass if top-3 < ~55% of AUM or equal-weight proxy / average stock participation shows supportive flows or relative strength.
Fail (cap Conviction at 65) if top-3 >65% and no evidence of participation beyond mega-caps. Always note actual concentration %.
Cross-Asset: TLT/AGG or ICI equity vs bond flows. State if equities are in net outflow to bonds.
Second Source: Use Seeking Alpha, ICI, SSGA, or Bloomberg flow notes where relevant.
Valuation Context (Recommended Layer): Note whether sector appears cheap, fair, or expensive on simple historical or relative metrics (P/E, vs peers, vs history). Use as tie-breaker or sizing modifier.
Technical Confluence (Recommended Layer): Does price / relative strength confirm the flow momentum? Note breakout, support, or distribution signals.
Stock Drill (on the six sectors):
Top 3 holdings by weight + label (Mega-cap Ballast or High-Beta).
One-line idea + one-line caveat (tied to flows, macro driver, or concentration risk).
TABLE 2 — Stock Ideas (for confirmed high-conviction names only).
OUTPUT (Exact Structure)
TABLE 1 (full ranking with all columns and Late-Stage flags)
TABLE 2 (stock ideas for top confirmed names)
Then these exact bullets:Gross Equity Stance: [Reduce / Neutral / Increase] — reason (incorporate broad flow picture + macro regime + cross-asset).
Highest Conviction Inflow(s): Sector(s) + recommended sizing + conditions (reference Late-Stage if applicable).
Highest Conviction Outflow(s): Sector(s) + action.
Provisional / Unresolved / Late-Stage Risk Names: With upgrade conditions.
Watchlist / Early Positive Flip Candidates: Unloved or negative-exhaustion sectors showing early 5D positive flips against negative longer trends (high legs-left potential).
Falsification Triggers: One testable line per recommended position.
Framework Health / Data Quality Summary: Number of provisional/stale/incomplete names, overall data freshness, any macro regime notes affecting interpretation.
ADDITIONAL RULES
Gross equity reduction takes priority over sector longs.
Use “Start size / Provisional” when data is unstable, single-source, incomplete, or Late-Stage Risk applies.
Failed breadth or provisional status must reduce recommended sizing.
Even model-supported names receive conservative sizing; high-exhaustion or Late-Stage names are capped at Start/Provisional.
Portfolio-level considerations: Respect sector correlations, total equity beta, and liquidity for intended size.
Keep language direct. No narrative padding."
@grok considering finding the next NVDA isn't just about whether the name sounds similar; what really needs to be screened for is demand explosion, profit margins, supply barriers, and customer stickiness. Miss one link, and it's easy to turn into a concept stock. What stock is closest to the early pre explosion NVDA?
A Midland citizen peacefully requesting public records in City Hall was pepper-sprayed, detained, and hospitalized by police with no crime identified or charges filed, raising serious constitutional rights concerns.
@Nino_Merica@TXAG@GregAbbott_TX@DOJ@FBI@TheJusticeDept Please investigate this apparent excessive force and potential public corruption in Midland TX.
Video evidence shows calm interaction escalating without justification; transparency and accountability are essential to protect citizens' rights.