BERNSTEIN: Global Memory
> Analysts forecast a 2-2.5x increase in HBM Average ASP year-over-year (YoY) heading into 2027. This price hike is expected across all generations of HBM (HBM3, HBM3E, HBM4, etc.).
> DRAM industry prices are forecasted to continue rising after 2QCY26 (though at a slowing quarter-over-quarter rate) and are expected to hit their cyclical peak in CY2027.
> Conventional DRAM currently generates considerably more revenue per wafer capacity than HBM.
> The gross margin gap between conventional DRAM and HBM is expected to significantly contract by 2027, with conventional DRAM GM approaching the mid-90% range and HBM GM climbing near 90%.
> Samsung is projected to gain HBM market share by bit shipment (climbing from 28% in CY2025 to 46% by CY2027E), driven by better HBM4 performance and increased capacity.
> Due to the massive expected price increases, HBM's contribution to total DRAM revenue is forecasted to experience a sharp, V-shaped rebound for all major players starting next year, hitting an industry total of nearly 40% by CY2027E and up to ~45% by CY2028E.
> Across all three major memory makers, earnings are modeled to reach a peak in the second half of calendar year 2027 (2HCY27). Samsung's EPS is expected to spike just past 20,000 KRW. SK hynix's EPS is projected to max out near 150,000 KRW. Micron's Non-GAAP quarterly EPS is forecasted to push close to $47.00–$50.00 USD.
Memory is about to become the most important line item in every device you own and one company is set to capture most of it (Save this).
Apple's cost to build an iPhone 17 Pro is $582 and the estimated cost for the iPhone 18 Pro jumps to $726 driven almost entirely by memory going from $39 to $145 and storage going from $13 to $51.
The AI memory demand permanently repricing the cost of every piece of consumer electronics on the planet.
Apple’s most recent earnings were strong with $111.2B in revenue, up 17% YoY, iPhone revenue up nearly 22%, and gross margins at an iPhone-era record.
But underneath all of that, Apple is currently absorbing a 230% jump in DRAM costs and deliberately not passing it to consumers to protect its upgrade cycle.
Apple's long-term supply agreements with Samsung and SK Hynix only run through mid-2026 meaning iPhone 18 launch season opens directly into spot pricing.
When the world's most disciplined supply chain manager is paying 230% more for memory and still cannot pass it on to buyers, you know exactly how tight the supply side is and who wins on the other end of that transaction.
This is not an Apple-specific problem, AI data centers are consuming roughly 70% of all high-end DRAM in 2026, a complete flip from prior cycles when consumer devices drove demand.
Goldman Sachs calls it the most severe memory shortage in fifteen years while TrendForce puts Q1 2026 DRAM contract prices up 90 to 95% quarter over quarter revised upward from 55 to 60% just months earlier.
UBS sees shortages persisting at least until Q2 2028.
The memory market is a three-player oligopoly, SK Hynix, Samsung, and Micron and right now Micron is the most interesting name in the group.
SK Hynix got to Nvidia first on H100 and H200 and still leads with 62% HBM share.
Samsung has been losing ground due to HBM3E qualification delays while Micron, at 21% and rising, has already displaced Samsung on key customer allocations, a competitive outcome almost nobody expected two years ago.
Micron’s entire 2026 HBM supply is already sold out, and revenue estimates just jumped to $13.2B from $11.7B.
Micron also operates at its 1-gamma node, producing more bits per wafer than either competitor meaning its margins expand faster as prices rise.
The HBM total addressable market is projected to grow at a 40% CAGR and hit $100 billion by 2028.
Every new generation of Nvidia's architecture requires more HBM per chip.
Every expansion in AI inference and context windows drives more DDR demand and Micron benefits on both simultaneously and as the only US domiciled, CHIPS Act-backed, fully vertically integrated memory company in the path of this spending, it sits in an unusually protected structural position.
Come join Milk Road Pro for our full breakdown, what Micron's HBM roadmap looks like over the next two years our entire AI thesis.
Link below!
LLM Knowledge Bases
Something I'm finding very useful recently: using LLMs to build personal knowledge bases for various topics of research interest. In this way, a large fraction of my recent token throughput is going less into manipulating code, and more into manipulating knowledge (stored as markdown and images). The latest LLMs are quite good at it. So:
Data ingest:
I index source documents (articles, papers, repos, datasets, images, etc.) into a raw/ directory, then I use an LLM to incrementally "compile" a wiki, which is just a collection of .md files in a directory structure. The wiki includes summaries of all the data in raw/, backlinks, and then it categorizes data into concepts, writes articles for them, and links them all. To convert web articles into .md files I like to use the Obsidian Web Clipper extension, and then I also use a hotkey to download all the related images to local so that my LLM can easily reference them.
IDE:
I use Obsidian as the IDE "frontend" where I can view the raw data, the the compiled wiki, and the derived visualizations. Important to note that the LLM writes and maintains all of the data of the wiki, I rarely touch it directly. I've played with a few Obsidian plugins to render and view data in other ways (e.g. Marp for slides).
Q&A:
Where things get interesting is that once your wiki is big enough (e.g. mine on some recent research is ~100 articles and ~400K words), you can ask your LLM agent all kinds of complex questions against the wiki, and it will go off, research the answers, etc. I thought I had to reach for fancy RAG, but the LLM has been pretty good about auto-maintaining index files and brief summaries of all the documents and it reads all the important related data fairly easily at this ~small scale.
Output:
Instead of getting answers in text/terminal, I like to have it render markdown files for me, or slide shows (Marp format), or matplotlib images, all of which I then view again in Obsidian. You can imagine many other visual output formats depending on the query. Often, I end up "filing" the outputs back into the wiki to enhance it for further queries. So my own explorations and queries always "add up" in the knowledge base.
Linting:
I've run some LLM "health checks" over the wiki to e.g. find inconsistent data, impute missing data (with web searchers), find interesting connections for new article candidates, etc., to incrementally clean up the wiki and enhance its overall data integrity. The LLMs are quite good at suggesting further questions to ask and look into.
Extra tools:
I find myself developing additional tools to process the data, e.g. I vibe coded a small and naive search engine over the wiki, which I both use directly (in a web ui), but more often I want to hand it off to an LLM via CLI as a tool for larger queries.
Further explorations:
As the repo grows, the natural desire is to also think about synthetic data generation + finetuning to have your LLM "know" the data in its weights instead of just context windows.
TLDR: raw data from a given number of sources is collected, then compiled by an LLM into a .md wiki, then operated on by various CLIs by the LLM to do Q&A and to incrementally enhance the wiki, and all of it viewable in Obsidian. You rarely ever write or edit the wiki manually, it's the domain of the LLM. I think there is room here for an incredible new product instead of a hacky collection of scripts.
Micron's CEO just dropped the most bullish forward guidance in the company's history and the earnings report is 8 trading days away (Save this).
In Q2 FY2026, Micron reported revenue of $23.86 billion, up 196% year-over-year, with a non-GAAP gross margin of 75% and free cash flow of $6.9 billion, a figure that exceeds Micron's entire annual revenue as recently as fiscal 2024.
That was the fourth consecutive quarterly revenue record, and the $10.2 billion sequential increase was the largest in the company's history.
Then management guided Q3 FY2026 to $33.5 billion in revenue with 81% gross margins and EPS of $19.15, a figure so far above Wall Street's prior consensus of $24.29 billion that analysts had to rewrite their models entirely.
If achieved, that Q3 print would imply Micron generating over $27 billion in gross profit in a single quarter, marking one of the most profitable quarters for any memory company in history.
The bull case for understanding why this is possible and potentially sustainable starts with one product, high-bandwidth memory.
HBM is the critical bottleneck in every AI accelerator supply chain, Nvidia's Blackwell and Rubin architectures require it in substantial volumes, and the global HBM market is controlled by exactly three companies, SK Hynix, Samsung, and Micron.
Micron is the only American HBM supplier, which gives it a geopolitical moat that no amount of capital can quickly replicate.
More importantly, Micron's entire 2026 HBM capacity is already sold out and contracted at fixed prices, meaning the $33.5 billion Q3 guidance is not a forecast built on hope, it is largely revenue that has already been booked.
The demand side of this equation is equally extraordinary.
Hyperscaler capital expenditure commitments for 2026 alone exceed $500 billion, including Microsoft at $190 billion and Meta between $125 billion and $145 billion, and every AI server requires roughly six times more DRAM than a conventional server.
Micron's CEO Sanjay Mehrotra stated on the earnings call that the company can only fulfill 50% to two-thirds of key customer demand in the medium term meaning the constraint right now is not demand, it is how fast Micron can build.
To address that, Micron raised its capital expenditure guidance by $5 billion to over $25 billion for fiscal 2026, with spending expected to rise further into 2027 as it accelerates construction of new fabrication facilities in Idaho and Taiwan.
The board also approved a 30% increase in the quarterly dividend, a signal from management that they believe the cash generation is durable, not cyclical.
The HBM market itself is projected to grow at a 41% compound annual growth rate, expanding from $35 billion to over $100 billion by 2028, and Mizuho analyst Vijay Rakesh has projected DRAM contract pricing could see a 355% increase through 2026 while NAND prices could rise 510%.
The Q3 earnings report on June 24-25 is not just a quarterly print but rather the verdict on whether AI memory demand has permanently broken the boom and bust commodity cycle that defined Micron for decades.
Come join Milk Road Pro for our full breakdown, how to size MU ahead of the June 24-25 earnings, what the $33.5 billion guidance implies for full year estimates, and our entire AI thesis.
Link below.
This is WILD!
Goldman Sachs says Wall Street consensus 2027 hyperscaler Capex estimates are too conservative (Save this).
The consensus lands at $920 billion but Goldman thinks it could reach $1.4 trillion.
Here is how they get there.
Hyperscaler capex, the combined AI infrastructure spending of Amazon, Google, Meta, Microsoft, and Oracle went from $261 billion in 2024 to an estimated $805 billion in 2026, a 3x increase in two years.
The consensus for 2027 assumes growth decelerates sharply to just 22%, which is where Goldman pushes back.
Goldman economists compared that assumption against every major infrastructure buildout in history, railroads, highways, electrification, the internet and found they consistently consumed 2 to 3% of GDP at their peak.
At 2% of US GDP, hyperscaler capex reaches $950 billion in 2027 and at 3%, it reaches $1.25 trillion.
In the most aggressive scenario where hyperscalers deploy every dollar of operating cash flow plus the full capacity of the investment grade credit market, the number reaches $1.43 trillion.
The fourth chart is what makes the Goldman case feel earned rather than aggressive.
Hyperscalers are expected to reinvest 98% of operating cash flows directly back into capex in 2026, a ratio only ever matched during the telecom bubble of 2001.
The critical difference is that these companies are actually generating the cash flows that are being reinvested, Amazon, Google, Meta, and Microsoft combined are printing hundreds of billions in operating cash every year and putting nearly all of it back into infrastructure.
A buildout this large creates supply chain pressure and earnings volatility in the names most exposed, and Goldman is not dismissing that risk but the direction of spending is not in question, the only debate is whether 2027 comes in at $920 billion or $1.4 trillion.
The companies sitting directly in the path of that spending are the ones worth owning.
Nvidia captures the largest share of every hyperscaler capex dollar, owning 80%+ of AI training compute, and Morgan Stanley raised its 2026 capex estimate specifically because of continued Nvidia demand.
Oracle is the fastest growing capex spender among the five hyperscalers on a percentage basis up 116% from 2024 to 2027 with the smallest absolute base, giving it the most runway remaining.
CoreWeave and Nebius sit between the hyperscalers and frontier AI companies, renting GPU capacity to anyone who cannot get on the hyperscaler queue fast enough and as that capex number grows, so does their total addressable market.
Milk Road subscribers already up massively on these names, come join Milk Road Pro for our full breakdown and what other names we are watching for just a dollar.
Link below!
Two economists just published a mathematical proof that AI will destroy the economy.
Not might. Not could. Will — if nothing changes.
The paper is called "The AI Layoff Trap." Published March 2, 2026. Wharton School, University of Pennsylvania. Boston University. Peer reviewed. Mathematically modeled.
The conclusion is one sentence.
"At the limit, firms automate their way to boundless productivity and zero demand."
An economy that produces everything. And sells it to nobody.
Here is how you get there.
A company fires 500 workers and replaces them with AI. A competitor fires 700 to keep up. Another fires 1,000. Every company is behaving rationally. Every company is following the incentives correctly. And every company is building a trap for itself.
Because the workers who were fired were also customers.
When they lose their jobs faster than the economy can absorb them, they stop spending. Consumer demand falls. Companies respond by cutting costs — which means automating more workers — which means less spending — which means more falling demand — which means more automation.
The loop has no natural exit.
The researchers tested every proposed solution. Universal basic income. Capital income taxes. Worker equity participation. Upskilling programs. Corporate coordination agreements.
Every single one failed in the model.
The only intervention that worked: a Pigouvian automation tax — a per-task levy charged every time a company replaces a human with AI, forcing them to price in the demand they are destroying before they pull the trigger.
No government has implemented this. No major economy is seriously discussing it.
Meanwhile the numbers are already tracking the curve. 100,000 tech workers laid off in 2025. 92,000 more in the first months of 2026. Jack Dorsey fired half of Block's workforce and said publicly: "Within the next year, the majority of companies will reach the same conclusion."
Nobody is doing anything wrong. Companies are following their incentives perfectly. That is exactly the problem.
Rational behavior. At scale. Simultaneously. With no mechanism to stop it.
Two economists built the math. The math leads to one place.
Source: Falk & Tsoukalas · Wharton School + Boston University ·
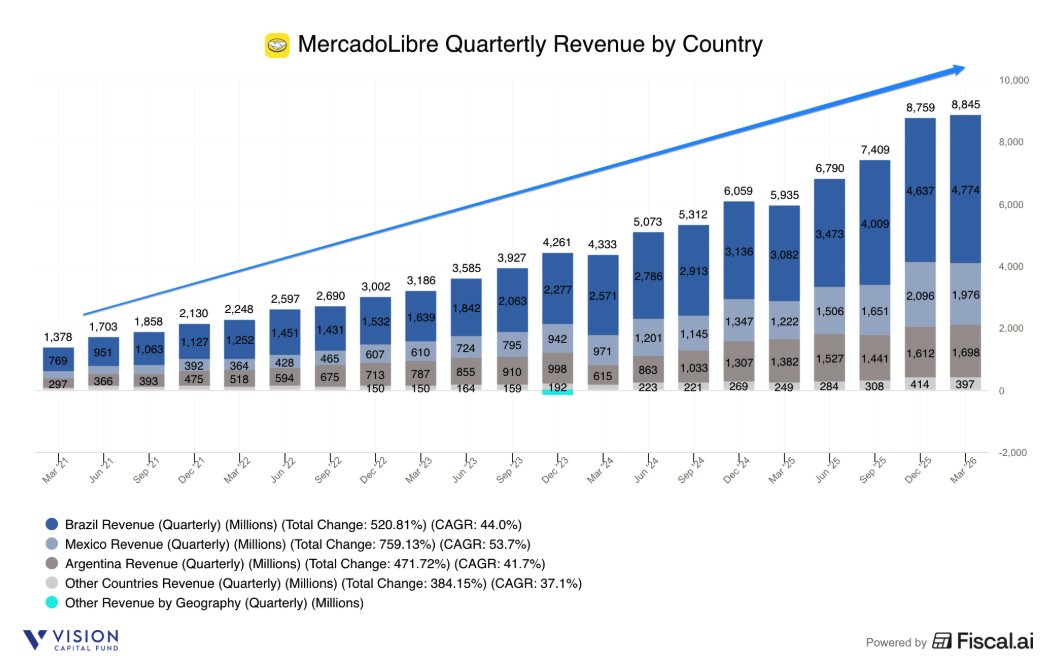
MercadoLibre $MELI 1Q26 Earnings
- Rev $8.8b +49% ↗️🟢
- GP $3.9b +39% ↗️🟢 margin 43.7% -303 bps ↘️🔴
- Adj EBITDA $857m -8% ↘️🔴 margin 9.7% -606 bps ↘️🔴
- EBIT $611m -20% ↘️🔴 margin 6.9% -595 bps ↘️🔴
- Net Inc $417m -16% ↘️🔴 margin 4.7% -361 bps ↘️🔴
- OCF $2.1b +101% ⤴️🟢 margin 23.5% +609 bps ✅
- FCF $1.8b +138% ⤴️🟢 margin 20.4% +761 bps ✅
Total
- Service Rev $7.7b +45% ↗️🟢
- Product Rev $1.1b +84% ⤴️🟢
- Commerce $4.9b +47% ↗️🟢
- Fintech $4.0b +51% ↗️🟢
Brazil
- GMV +30% FXN ↗️🟢
- Sold Items +45% ↗️🟢
- Total Rev $4.8b +55% ↗️🟢
- Service Rev $4.0b +49% ↗️🟢
- Product Rev $787m +92% ⤴️🟢
- Commerce $2.8b +51% ↗️🟢
- Fintech $1.9b +61% ↗️🟢
- Contribution $389m -28% ↘️🔴 margin 8.1% -944 bps ↘️🔴
Mexico
- GMV +23% FXN ↗️🟢
- Total Rev $2.0n +62% ↗️🟢
- Service Rev $1.8b +60% ↗️🟢
- Product Rev $202m +76% ⤴️🟢
- Commerce $1.2b +54% ↗️🟢
- Fintech $781m +76% ⤴️🟢
- Contribution $344m +59% ↗️🟢 margin 17.4% -35 bps ✅
Argentina
- GMV +126% FXN ↗️🟢
- Total Rev $1.7b +23% ↗️🟢
- Service Rev $1.6b +22% ↗️🟢
- Product Rev $91m +32% ↗️🟢
- Commerce $573m +21% ↗️🟢
- Fintech $1.1b +24% ↗️🟢
- Contribution $607m -6% ↘️🔴 margin 36% -1114 bps ↘️🔴
Others
- Total Rev $397m +59% ↗️🟢
- Service Rev $347m +53% ↗️🟢
- Product Rev $50m +127% ⤴️🟢
Commerce $274m +54% ↗️🟢
- Fintech $123m +73% ⤴️🟢
- Contribution $64m +42% ↗️🟢 margin 16% -195 bps ↘️🔴
Biz Metrics
- Unique Active Buyers 84.1m +26% ↗️🟢
- Fintech MAU 82.9m +29% ↗️🟢
- GMV $19b +42% ↗️🟢
- Items Sold 722m +47% ↗️🟢
- Items Sold per Unique Active Buyer 8.6 units +16% ↗️🟢
- Live Listings 773m +62% ↗️🟢
- Managed Network Penetration 95.5% +70bps ↗️🟢
- Same & Next Shipments 199m +39% ↗️🟢
- TPV $87.2b +50% ↗️🟢
- TPV Acquiring $56b +39% ↗️🟢
- TPV Acquiring (off) $36.2b +39% ↗️🟢
- TPV Acquiring (on) $19.8b +39% ↗️🟢
- TPV Fintech Svcs $31.2b +73% ⤴️🟢
- TPN 4.6b +39% ↗️🟢
- Monthly Active Sellers with Credit 36.0% total ↗️🟢
- AUM $19.9b +77% ⤴️🟢
- Credit Portfolio (CP) $14.6b +87% ⤴️🟢
- CP (Credit Card) $6.6b +104% ⤴️🟢
- CP (Consumer) $5.3b +79% ⤴️🟢
- CP (Merchant) $2.3b +64% ↗️🟢
- CP (Asset Backed) $0.3b +85% ⤴️🟢
- NIMAL 17.8% -980bps ↘️🔴
- Past Due 15-90 days 8.0% of NPLs/Total Portfolio ➡️🟢
- Past Due 90+ days 17.6% of NPLs/Total Portfolio ➡️🟢
- % Allowance of Doubtful Accts / NPLs >15 days past due 103% ➡️🟢
- % Allowance of Doubtful Accts / NPLs >90 days past due 149% ➡️🟢
1 | Q1 saw very strong growth as MELI heavily reinvested in its commerce and fintech business.
I'm pleased to report that we ended 2025 with robust operating trends that reinforce the strength of the MercadoLibre ecosystem. Our relentless focus on customer experience translated directly into strong financial performance with fourth quarter net revenues growth of 45% year-over-year. Our performance is supported by 2 primary growth drivers: the acceleration of our commerce business, and the rapid adoption and structural expansion of our fintech services.
2 | Near-term investments in Brazil lowering of shipping threshold, credit card in Brazil, Mexico, and Argentina, 1P commerce and cross-border trade (CBT) with China and US, pressured margins by 500-600bps.
We talked a lot about the results of those investments, but we wanted to give a sense of what those investments were in terms of margin compression….lowering of the shipping threshold that we did last year in Brazil. The credit card, we are investing in Brazil, Mexico and now Argentina, and the 1P, which is continuous its path to profitability, but still not profitable on its own. The same thing with CBT, which we are expanding now to the China and the U.S. corridor and then we also added the smaller countries where we continue to invest as we reach scale in those countries. So when we put all that together, we wanted to give you a sense of the pressure that, that generated on our margins and that gives you a range of between 5 and 6 points.
3 | Continued to enhanced the free shipping value proposition in Brazil commerce, lower free shipping thresholds, driving higher purchase frequency, new buyers, larger volumes, higher revenues, and improving efficiency.
Turning to commerce. In Brazil, our largest market, GMV grew an impressive 35% YoY alongside a 45% increase in sold items. This acceleration is the result of our strategic investments to enhance the value proposition, most notably the decision to lower the free shipping threshold. More free shipping is driving higher purchase frequency and bringing new buyers into the ecosystem. This volume is translating directly into efficiency. Our logistics network absorbed the increase in volumes while driving productivity gains, proving our ability to scale effectively.
4 | Confident of strong underlying unit economics that CBT, 1P and credit card when scaled will be profitable.
In terms of the trajectory, I think it's in line with what we have been talking about this in the past. CBT is a business that when it's locally fulfilled, is profitable, international fulfillment needs to continue scaling and moving in the right direction, but it will continue to scale and it will put some pressure on margins because of that.
When you look at our 1P, I think we talked a lot about 1P. It continues to be profitable on a variable basis level before allocating central cost, direct indirect cost is profitable. So the scale will play in our favor in terms of continuing to improve profitability.
I think the credit card, Osvaldo will talk about this, I'm sure, in some of the questions, but the credit card continues to improve its profitability, in particular in Brazil, where we're seeing already a significant part of the portfolio, the other cohorts being profitable….if you look at Brazil, which is the oldest cohort we have been issued credit cards in Brazil since 2021, cohorts that are older than 2 years are already profitable at a NIMAL level. So that gives us a lot of encouragement to continue expanding the user base.
5 | While NPLs decline slightly QoQ, NIMALs actually improved, more important to focus on what the risk was priced
regarding NPLs and the impact of a little bit -- a slight deterioration in NPLs from the third quarter to the fourth quarter. And that is -- so that is -- I would say that in general, NPLs of the credit card book fell to an all-time low of 4.4% in Q4. Nonetheless, the increase in NPL was mostly related to the consumer and merchant books. But having said that, I think that more important than NPLs are NIMALs and those improve, meaning we are more profitable than we were a quarter before. Therefore, what we did was we increased the number of people and the riskier number of people we give credit to, but we price that risk accordingly. And therefore, we ended up having a significant -- a larger spread than we did on the prior quarter. So I think this was a calculated risk and it worked out well.
6 | MELI remains focused to grow the credit book only if it stays healthy, confident about the quality and health of the credit portfolio with their models and collection.
I think the philosophy on credit has always been that we will grow our credit books as long as we have a healthy book. And as Osvaldo mentioned, you're seeing only part of it -- part of the equation on the NPLs. But obviously, we are pricing those ahead of time. And the margins in Argentina and Mexico are extremely high.
So we feel very, very comfortable about the quality and the health of our portfolio. And that's the reason why you see our credit book growing at 90% because we are confident in our models and our collection.
7 | However in the near-term given the mix of different growth rates and profitability, it is more unclear but confident of the long-term path.
So I think a lot of moving parts, right? The individual businesses are growing and moving in the right direction. Then you have a shift issue because some of these are growing at a faster pace. But the bottom line is that we're very confident that the investments that we're making in our platform and addressing the long-term opportunities that we see ahead of us, and we're also improving user experience in our platform.
This particular quarter, we mentioned that we have the highest NPS level in commerce and fintech in Argentina, Brazil and Mexico. So that's a consequence of investments that we have been doing, and we're very comfortable with these levels of investments in our ecosystem.
8 | Argentina saw margin compression largely due to the opening of new fulfilment centers, and higher bad debt provisions from the credit card launch last year, combined with higher funding costs.
We see, as you mentioned, some compression in Argentina. Keep in mind, Argentina continues to be the highest profitability market in terms of margins. But we did see some compression mostly coming from fulfillment. As you know, we opened couple of new fulfillment centers recently, so that generated some year-on-year compression on COGS. Also, provisions for bad debt because of the credit card. We launched the credit card in the middle of last year. So we're still -- we're seeing some compression because of that. As you know, the credit card requires investments upfront. And there is some year-on-year increase on funding costs. It's true what you said. Sequentially, QoQ, the funding cost of our credit portfolio was lower in Q4 relative to Q3, but it still was higher relative to a year ago. So those are the main reasons for the compression that we saw in this quarter.
9 | In agentic commerce, focusing most of efforts of developing with MELI instead, because they have the first-party data to create the best search, recommendation, discovery.
to complement this comment, I would say that the part where we're putting most of our efforts is in developing our own agentic experience inside MercadoLibre. We think and we are convinced that we have the first-party data to create the best search, best recommendation, best discovery engine on which we can personalize and lay over the agentic experience that the new technology drives.
So -- and by the way, if you believe that there is a world of agentic commerce, that could mean that retail will move even faster from the offline to the online world. So all this to say that I do think that we are well-positioned to actually capturing ad revenues in the future because we still think that MercadoLibre will be go-to place for demand to do shopping online.
10 | Because they don’t know which hardware, which model people will use, and customers look for value and for the best end-to-end experience, it makes sense to take the risk and focus all of their efforts to build their own agents and shopping assistant within MELI instead.
Let me try to rephrase what I meant earlier as I try to address your point. I think there are things that we know and there are things that we don't know. So we don't know which hardware people will use in 10 years to buy. We don't know whether the winning model will be X, Y or Z and so on. We do know that consumers do value or do look for the best end-to-end experience. We do know -- and that means not only searching for products, but also getting products fast, having the widest selection, pricing, the best financing alternatives, post-purchase support and so on.
We also know there's a technology today that can dramatically improve the product discovery process. And for that reason, we are putting all of our efforts and deploying lots of engineers in building our own agents and our own shopping assistant within MercadoLibre. It's early to know what will happen with other shopping assistant. I take your point that it might present a risk. I understand where you're coming from. But we are confident that we are playing this one from a position of strength that we have the relationship with consumers. We have a brand that Latin America loves.
11 | Advertising should benefit if MELI can capture more agentic commerce traffic.
So we eventually what I'm trying to convey is that on the one hand, we are confident on MercadoLibre's own ability to capture traffic through its own agentic experience. And on top of that, we do think that advertising represents an additional revenue opportunity in a world in which there is agentic commerce.
And by the way, the agentic world can also imply a faster shift of advertising dollars moving from traditional offline channels into digital advertising, which generates the opportunity to be even bigger. So we remain positive, we remain focused. The only thing that we know for sure is that we need to put our developers to work to have the best tech stack for advertising and the best agentic experience inside MercadoLibre.
12 | Advertising revenue grew 67% in 1Q26 on broad base strength, driven by higher adoption and tech-stack improvement, excited about the long-term opportunity.
we are very pleased with the performance we had in ads this quarter. Revenue accelerated to 67% on an FX neutral with higher adoption and spend basically driven by improvements in our tech stack. It's broad-based. So there's no one silver bullet driving that growth.
But basically, we are attaching our product in the different parts of the value chain, right, auction bidding, placement optimization, demand generating initiatives and all that powered by an improved an easy-to-use platform in terms of front end for our customers. So extremely, extremely satisfied with that.
So penetration of ads with revenues as a percentage of GMV is still small compared to its potential. So very happy with the results so far, but even more encouraged with the potential looking ahead.
13 | Mercado Pago's AI assistant is solving 87% of interactions without the need for human support, right now it is largely servicing, but excited with it cross-selling and recommending services.
We are very excited by Mercado Pago's AI assistant it is already helping mostly with solving questions and concerns from our users. We have built a lot of functionality into our agent. Basically you can do pretty much everything you do with Mercado Pago with the agent.
Our Mercado Pago AI assistant is solving 87% of interactions without the need of human support. Millions of users already adopt this conversational tool to manage their credit card, make transfers and understand their credit offerings.
And beyond cross-sell, it will also become more proactive in terms of acting like a personal banker. So helping you, I don't know, allocate your portfolio or make the recommendations of what kind of credit is better for you. So we believe here that the opportunity is significant.
14 | AI seller assistant is currently already helping sellers with 20% of GMV
Just to complement Osvaldo here on the marketplace side, while we have many, many features that are powered by AI, starting with our search algorithm, our recommendation and so on, I think it's worth highlighting the fact that we have a seller assistant today running in our platform, basically 20% of our GMV is somehow advised by our assistant. It's actually proving to be pretty successful in helping sellers improve their live listing, reduce their lead times to get better reputation in our platform, capture some of their questions and requirements in terms of customer support.
15 | MELI’s lower margins comes not from weakness but from deliberate decisions to pursue growth opportunities that will gradually become more profitable over time. It is already showing up in improved customer metrics, NPS, higher revenue growth.
first, it's important to put in context when we talk about margins, the growth that we're delivering. Most of the margin pressure comes from deliberate decisions that we're making in terms of pursuing investments that are generating tremendous growth and improving user experience. As you mentioned, in Brazil, in particular, we have been growing our GMV and gaining market share, mainly because of these investments. Our top line grew by 45% year-on-year. As I mentioned earlier, our NPS is at record levels, and that's because of the investments that we have been doing. You mentioned CBT, 1P, the lower shipping presold, expanding more free shipping, increasing booking capacity. So we feel very comfortable with these investments and the current margin levels because we are seeing the results in terms of growth, market share gains and improvements in user experience and engagement.
16 | MELI will not hesitate to invest to capture these opportunities even if there will be short-term margin pressure, because they are not optimising for short-term profitability, but seeking to grow the business for the long-term.
As I said in the past, our main focus is on capturing the large opportunities in front of us in commerce, fintech and advertising. And we will not hesitate to invest and to order to capture those opportunities as we have done in the past, even if that puts some short-term margin pressure, we're not trying to optimize short-term margin. We manage the business for long term -- from a long-term perspective, we believe these investments are creating a foundation for future growth, and we remain confident in our long-term margin trajectory.
➡️ Key takeaways for MercadoLibre $MELI
MELI continues to grow as LATAM’s dominant e-commerce and fintech platform with a long growth runway with still low penetration. Unsurprisingly, the market in the near term often does not like companies who reinvest heavily and profitability falls. The difference is that the reinvestment is already showing up in strong growth and the underlying profitable unit economics are there, all MELI needs is time to grow and scale each opportunity. Confident in management taking the long-term to grow the business rather than to manage short-term profitability which is what we are not interested in.
Sharing my observations from Momentum Work's latest E-commerce in Southeast Asia 2026 report:
Despite ID being the largest at 36.6%, it is growing the slowest.
TH, VN, MY, and PH are smaller but the 4 fastest-growing markets.
Shopee continues to grow and remains the dominant player in SEA with a ~52.8% share.
Shopee gained share in ID, held in SG and TH, and lost in VN, PH, and MY.
TikTok Shop is rapidly gaining market share across SEA ex-SG, now at 28.3%.
Lazada remains in decline in SEA, down to 11.9%, losing share across all ex-SG markets.
Tokopedia continues to lose market share in Indonesia, down to 15.6%.
PS: One of my favorite reports to track is Sea Limited's Shopee's continued dominance and competition, especially from TikTok Shop.
$SE
SEA E-Commerce Market Share changes in SEA over the past 2 years.
A few observations and thoughts:
1. Shopee lost share in each market except Indonesia (going from an average of 55.3% to 52.7%)
This represents a 2.6% drop in market share, which in my view, is a minor loss considering TTS saw a 7.5% increase in market share 22.8% to 30.3%. Lazada, along with other single-country players were hit hardest.
Obviously, this is not an ideal scenario, but it is also not unexpected. TTS is a fantastic product and has been very aggressively subsidising growth across SEA. Shopee maintaining >50% market share in the region, while GMV grows 22.8% remains remarkable.
2. Shopee saw an 8% increase in market share within Indonesia, with TTS' gains limited to just 4% in the country.
Indonesia is the largest market in SEA, accounting for ~40% of the population. Shopee's focus in the country and rollout of the VIP programme appears to be paying dividends.
3. Single-country players are fading out as expected. Players like Blibli, Amazon and Tiki stand no chance in the region, accounting for <2% of total market share.
4. Lazada has continued to struggle across all markets, with MW reporting huge share losses and flat GMV growth year over year.
While it continues to be a three-player market today, Lazada has notably lost market share in several consecutive years since TTS' arrival. In 2025, Lazada again saw a drop in market share from 14% to 11.5%. I continue to believe that Southeast Asia will effectively be a two-player market in the foreseeable future.
Disclaimer: These figures are all reported by Momentum Works, that have confirmed these are estimations combining on-the-ground sources including platforms, merchants/brands, logistics players, enablers and other stakeholders.
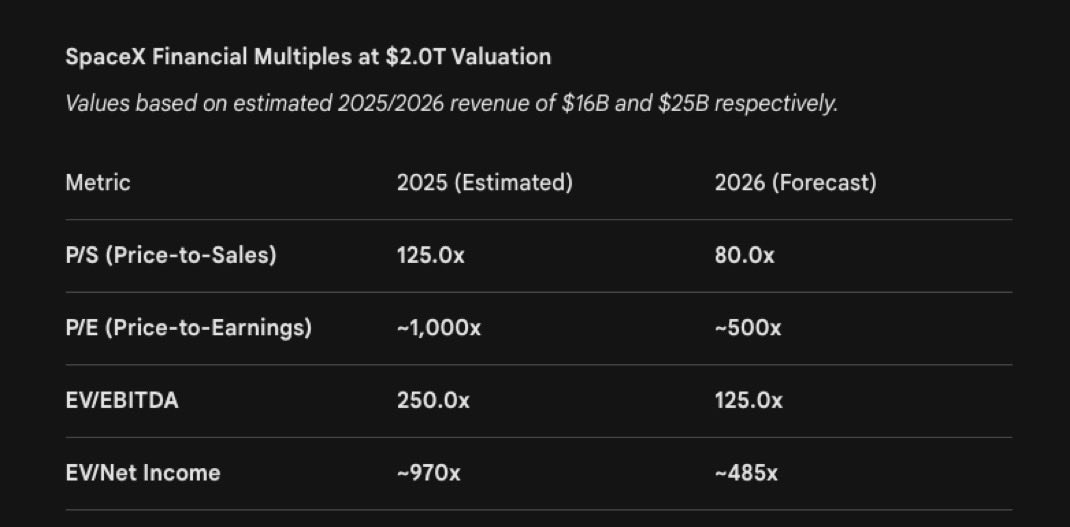
SpaceX IPO valuation: $2 trillion.
P/E ratio: ~1,000x.
For reference:
At 1,000x earnings, if SpaceX grew earnings 30% per year — every year — it would take 27 years to grow into its valuation.
At 50% earnings growth per year?
Still 18 years.
This isn't investing.
It's a pledge of faith.
SpaceX is extraordinary.
The technology is real.
Starlink is a genuine monopoly.
But at these multiples, you are not buying the company.
You are buying the dream.
And dreams don't always compound.