Your 9:30 Bias shouldn't start at 9:30
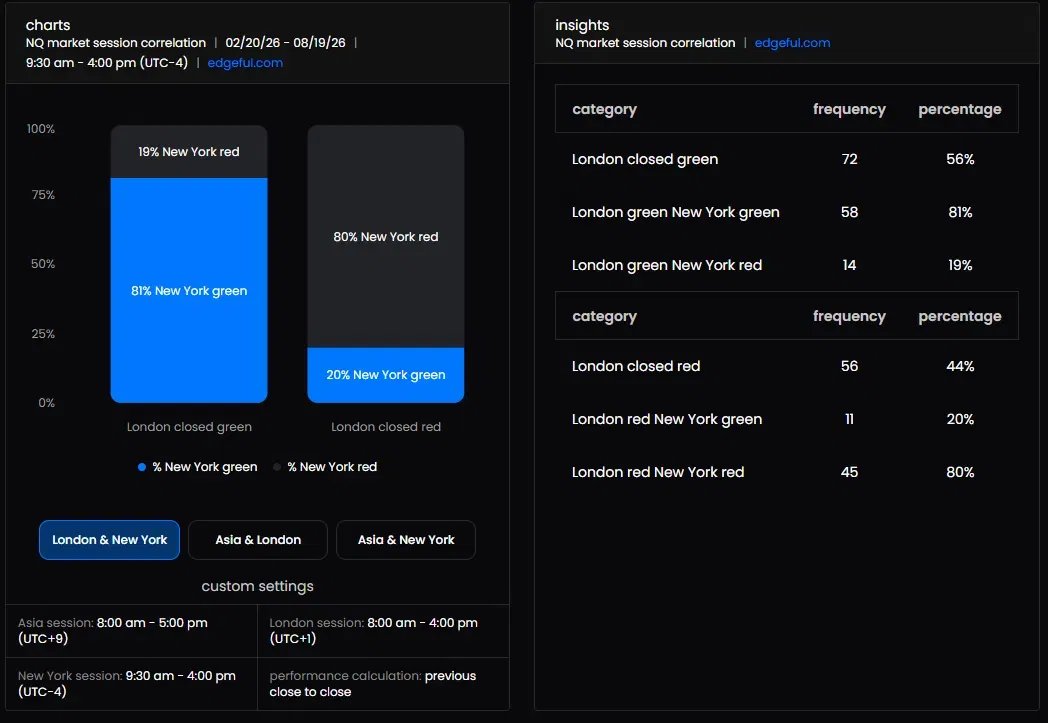
(according to @edgeful )
NQ correlation:
• London closes green → 81% chance NY finishes green
• London closes red → 80% chance NY finishes red
By the opening bell, London has already voted. Most days, New York just confirms it.
Trading slows down considerably once you are right-sized for risk. It is very hard to become profitable (and keep it) with random and/or oversized positions.
Build good habits and it will translate as you naturally size up. Consistency first.
Markets should be cheering on domestic champions like $AAOI.
Since it's ideal to support critical AI infra from laser fab to production in the US, rather than being a bear.
Feels like everyone just outsources transceivers to Asia like Malaysia or Thailand...
With $INTC, $IQE, $XFAB, $MU, $WOLF, $SOI, $SIVE, and others...
If you haven't noticed by now, they're all critical to US supply chains. And every one of them are getting subsidies for securing Western supply chains.
Before a major trade was to short developing US/Western equities, then hedge with subsidized foreign ones.
As seen with the energy/solar firms that went bankrupt, this backfired a lot on US AI infrastructure years later with the power grid.
I wanted to help change this mindset, since I believe it's very positive sum to invest in building up critical Western supply chains like photonics today.
Especially if $AAOI hits their $471m/month projections after reshoring their production to America.
Instead of hoping they fail and calling critical nodes in the supply chains memestocks/bubbles, maybe it's good to change mindsets a bit so we don't see a repeat of the US Solar sector years later.
US/EU don't just hand out subsidies or CHIPS act grants to anyone.
Everyone keeps asking for the list, so here’s the core focus watchlist I pay attention to most:
MAG7: $AAPL $MSFT $NVDA $AMZN $META $GOOGL $TSLA
Index / Leveraged: $SPY $QQQ $TQQQ $SQQQ $IWM $TNA
Crypto Related: $IBIT $COIN $MSTR
Oil/metals:
$USO $SLV $GLD
Top other Focus: $PLTR $AMD $AVGO $SMH $MU $SNDK etc.
You do NOT need 500 tickers to make money.
Master a small list first. Learn how they move. Learn correlations. Learn reactions. Learn volatility. Learn positioning.
Then expand.
Depth > randomness.
Most traders fail because they chase everything instead of becoming elite at a focused list first!
Bookmark it!
You only need a few hrs and a few tickers each week!
I figured this out 17 years ago.
This is why I never went “full time” originally.
Life’s too short to spend every min of the day glued to a screen especially when you make full time money in your spare time!
Something every new trader struggles with: picking the right technical method.
There's traditional technical analysis. Smart money concepts. Elliott Wave theory. Candlestick patterns. Order blocks. Order flow. Footprint charts. List goes on
After doing this for over a decade, here's a simple fact:
They all lead to the same outcome. Just different journeys.
Think of it like a road trip.
You can use:
- Paper road maps
- Atlases
- Roadside signs
- Google Maps
- Apple Maps
- Waze
- GPS devices (Garmin, TomTom)
- Car built-in navigation
They all get you to the same destination. Some are faster. Some give you more detail. Some are easier to use.
But at the end of the day? You still arrive.
Trading methods work the same way.
Traditional technicals? Works.
Smart money concepts? Works.
Elliott Wave? Works (if you have the patience).
Order flow? Works.
The method isn't the problem. Sticking with one long enough to actually learn it is.
New traders jump between methods like they're switching GPS apps every 5 minutes.
You'll never arrive if you keep switching.
Pick one method. Learn it. Master it. Stick with it through the losing streaks.
The journey might look different than someone else's, but if you stay on the path, you'll get there.
There isn't one perfect method.
SPY GAMMA analysis for April 30:
Spot Price: 715.33
Total Net GEX: +3.91B (POSITIVE GAMMA)
This is a major shift in regime compared to earlier sessions. The market has transitioned from negative gamma (volatile, unstable) into positive gamma, which typically results in more controlled, range-bound price action.
MARKET STRUCTURE
The GEX profile is now heavily concentrated above and around current price, especially near:
715 (largest concentration)
716–720 (stacked positive gamma above)
710–712 (support band below)
This tells you that dealers are now long gamma, which changes how the market behaves.
WHAT POSITIVE GAMMA MEANS
When dealers are long gamma:
They sell into strength (caps upside)
They buy into weakness (supports downside)
Volatility compresses
Price tends to stay within ranges
This is the opposite of what you were seeing earlier in the week.
KEY LEVELS
Resistance: 716–720
This is where the largest positive gamma sits above price. Expect sellers to step in as price approaches this zone. Breakouts will be harder and require strong momentum.
Pivot: 714–715
This is the current control zone. Holding above keeps the structure bullish-neutral. Losing it shifts momentum lower.
Support: 710–712
This is a strong support band. Dealers will likely provide buying support here. First major reaction zone on any pullback.
Breakdown Zone: 700
If price reaches this level, it likely means gamma structure has shifted again. This would reintroduce volatility and downside expansion.
POSITIONING INSIGHT
The concentration of positive GEX at 715 indicates:
This level is acting as a magnet
Price may gravitate toward it and stall
Expect mean reversion behavior, not trend continuation
Above 720, gamma begins to thin out. That means:
If price breaks and holds above this area
You can see a transition back into expansion
Below 710, negative exposure increases:
A breakdown here would likely trigger faster downside movement
TRADING IMPLICATIONS
This is a range-trading environment, not a breakout environment.
Best strategies:
Fade extremes (sell resistance, buy support)
Take quicker profits
Avoid chasing breakouts without confirmation
GAME PLAN
Bullish Scenario
If price holds above 714–715:
Expect grind higher toward 718–720
Movement will likely be slow and controlled
Break above 720 requires strong volume and momentum
Bearish Scenario
If price loses 714:
Look for move toward 710–712
Expect buyers to step in at first test
Breakdown below 710 opens path toward 705 and possibly 700
INTRADAY EXPECTATION
Lower volatility compared to prior sessions
More consolidation and chop
Controlled moves instead of sharp expansions
False breakouts are more likely
WHAT TO WATCH
Reaction at 715 (control level)
Acceptance above 720 (trend continuation signal)
Failure at 715 followed by loss of 710 (shift back to bearish)
Volume on any breakout attempt
BOTTOM LINE
The market has shifted into a positive gamma environment, which favors:
Range-bound trading
Lower volatility
Mean reversion
715 is the key level controlling price.
Above it, the market grinds higher but faces resistance.
Below it, the market rotates back into support zones.
Breaks outside of 710–720 are where real opportunity begins.
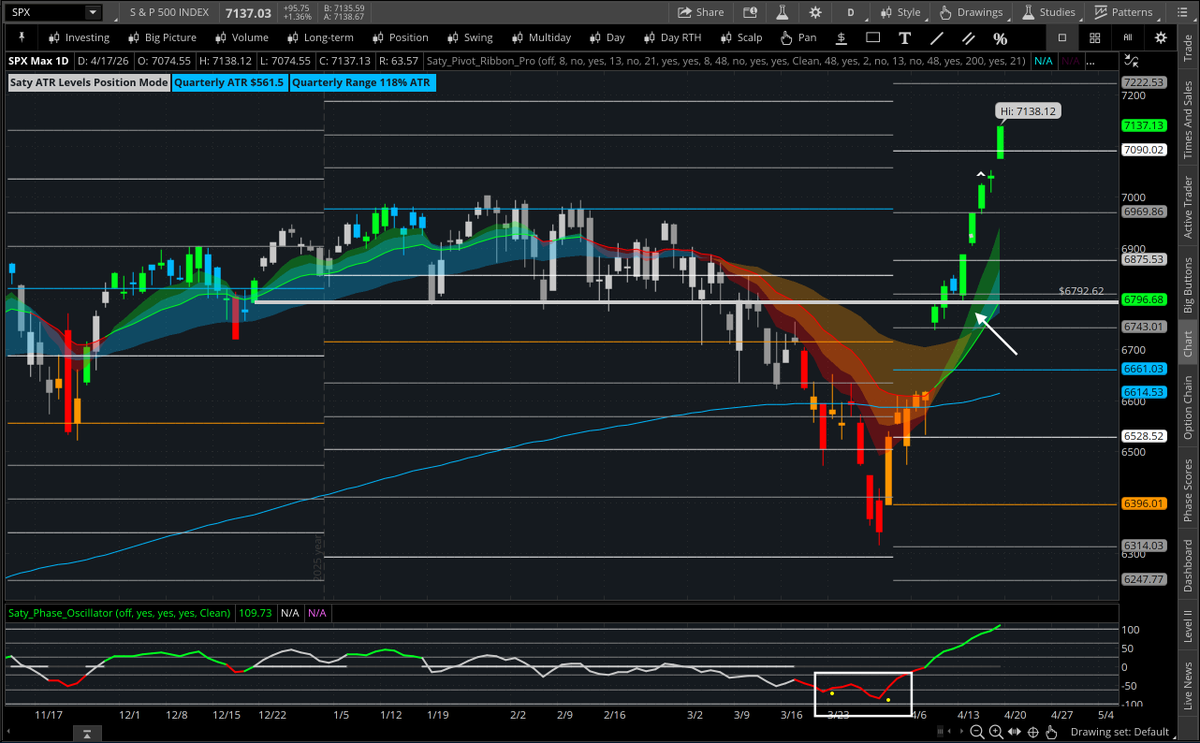
S&P 500: $SPX | $SPY
- 3/29 we talked about short-covering from the daily PO accumulation zone. I thought this was going to be a local bottom for daily mean reversion but absolutely didn't expect this face ripper.
- This week held the 6800 key pivot and never looked back.
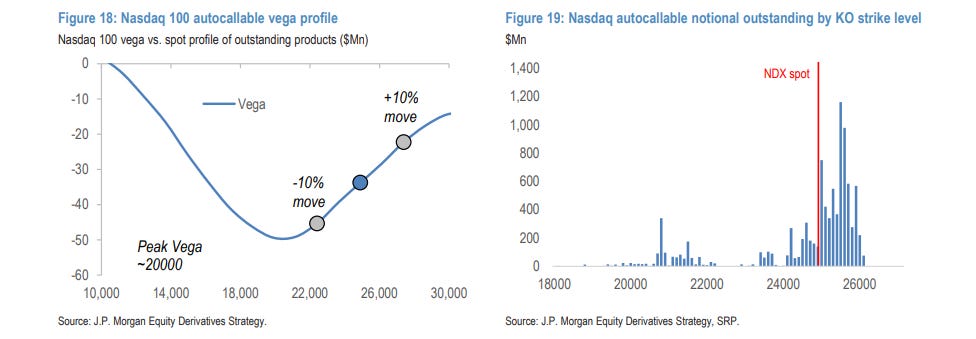
Q1’26 Structured Products Update:
-Monthly index issuance continues to post record highs at around $6B per. There’s very strong demand for income products given the turn of a new year and large product KOs.
-Since a lot of the issuance from ‘25, markets have been near all time highs which drove some knock-outs, so once again, dealers have been selling more Vega as those synthetic puts go away and new issuance comes in.
-All indices are above the majority of estimated upside KO barriers:
$RTY: 85% of products
$SPX: 70% of products
$NDX: 35% of products (although more would if market rallied a few percent).
-Knock in put strikes remain far OTM for all indices so here’s where the majority sit:
$RTY: 1450-2000
$SPX: 4000-5400
$NDX: 14500-18000
-Autocallable Vega outstanding: $RTY: $35m. $SPX: $50m. $NDX: $35m. (Vega risk is significantly increasing however given the drawdown from recent ATHs).
-Peak Vega: Ref 3/24/26 SPX 6560.
$RTY: 17% from peak Vega (2050)
$SPX: 15% from peak Vega (5400-5500)
$NDX: 15-17%% from peak Vega (20000).
I just thought these were interesting:
-Innovator launched quarterly dual‑directional defined outcome ETFs.
$DDSQ quarterly dual directional 5 buffer on $SPY (3.34 % upside cap, 5 % buffer).
Basically just sells OTM SPY strangles.
-5x Leveraged Single Stock ETFs ( $TSLA, $NVDA, $AMD, $AMZN, $PLTR, $COIN, $MSTR).
-ProShares is trying to make a retail focused ticker for CBOE’s $VA (Variance futures).
-Trending towards MAG7 0DTE Mon-Fri so we’re gonna see many more products tied to selling daily vol.
Just my informal thoughts on some of these products and new trends are that it's getting quite insane to watch just how much issuance is tied to dogmatically selling vol. The majority of those who are buying these products don't understand the implications of what they're doing. Participants focused on trading relative vol arbs are quite happy given the many new opportunities across the landscape. I've basically been alone in sounding the alarm on what can happen during the next real tail event (Asia comparison). We just haven't seen anything like a major 2020 drawdown sort of event since structured products have tripled in size with many new types of notes and even more leverage. April 2025 only just scratched the surface. It's not a fear monger one bit, it's just simply modeling out if X then Y. Anyways, I digress.