Notes on the economy, geopolitics and markets: the forces behind the headlines. Primary data, plain language, no hype. Opinion only, not investment advice.
Affordability: one crisis, two currencies
Cost of living was a defining issue of the US midterms: about half of voters called it crucial to their vote (AP Voter Poll). Across Europe, housing has moved to the centre of politics too. Different systems, same complaint.
1/ Europe: the house outran the payslip.
Since 2015, EU house prices are up 53%, average pay 33% (to 2024, the latest pay data). Prices have kept rising since: +62% by 2025. On average, the same home now takes 15% more years of pay, and the average hides much sharper local gaps.
2/ US: the price of money on top.
US house prices rose 91% since 2015, household income 55%: 23% more years of pay for the same home. Then comes the rate. A new 30-year mortgage costs 7.11%, while about half of existing mortgages pay under 4%. On the median new home, that is 29% of median household income at today's rate vs 21% at 4%. Euro-area borrowers pay around 3.6%.
3/ That is where the K is drawn.
The evidence for a K in spending is mixed. The K in balance sheets is clearer: owners with cheap debt and rising assets on one side; renters and first-time buyers on the other. The median US first-time buyer is now 40, up from ~30 in 2010. The median repeat buyer is 62.
4/ Markets feel both arms.
The upper arm owns the assets, so rising prices sustain its spending. The lower arm is rate-sensitive and stretched. Headline growth can look resilient while sentiment sours, which is why markets and ballots can tell different stories at the same time.
5/ Public debt narrows the exits.
US federal debt is ~99% of GDP and interest (~$1.04T) now exceeds defence spending (CBO, FY26). Euro-area debt stands at 88.8% of GDP. Borrowing to ease affordability can lift the long-term yield, the rate that sets mortgages, and history suggests demand support without new supply tends to show up in prices.
6/ Our reflection.
Affordability looks less like a cycle than a regime: scarce housing, expensive money and heavy public balance sheets reinforcing each other. The lasting fixes (more homes, higher productivity and real wages) are slow. Until then, the gap between asset owners and earners is likely to shape both markets and elections, on both sides of the Atlantic.
Markets will evolve. These are notes, not answers.
#Affordability #Housing
$SPY $TLT $ITB $XHB
Yesterday: liquidity hasn't shrunk, its price has. Today, the other half of the story: the dollar.
The euro is down 5% against the dollar in a year (1.158 → 1.098). The usual explanation is the rate gap. But the US 2-year yield rose 1.22 pts and Germany's 1.12. The gap barely moved.
So what else is lifting the dollar?
• Growth: US factories run hotter (ISM 55.5 vs 52.7 in the euro area)
• Deleveraging: when copper, gold and bitcoin are sold at once, demand for the funding currency rises
• Energy: Brent's spike to $126 in April hit Europe's import bill. That one has faded.
What would change the read: a softer US ISM on 1 December, or the selling running out.
#Dollar #EURUSD
$DXY $UUP $FXE
Copper is down ~16% since mid-October, its weakest since April. Gold is down ~11% over the same weeks.
When both fall together, it usually says more about money than about demand. The dollar is at its highest since March 2025 and markets are pricing more Fed hikes.
The real economy tells a different story so far: China's copper import premium hit a record ($285/t) and US factories are busy (ISM 55.5, production at 59).
Ironically, strong activity is part of the problem: it keeps rate-hike bets alive.
What would change our read: ISM new orders below 50 on 1 December, or China's premium fading.
#Copper #Commodities
$CPER $GLD $DXY
@joemccann@GoldmanSachs Specs selling while producers and users add longs fits the physical market: China's import premium hit a record ($285/t), even as LME stocks rose from 205kt to 320kt since August.
Gold falling with copper looks more like a dollar/rates squeeze than a demand collapse. $COPX
Close: $NVDA beat. Revenue $115.8B (+103% y/y) vs ~$108.8B expected; adj. EPS $2.68 vs ~$2.47.
The guide needs a closer read:
• $130B includes an extra week. Pro-rated: ~$121B, ~+4% q/q after +20%
• Gross margin 71–72%, from 74.9%
+4.5% after hours. $SPY −1.0%, VIX 25.
Is a liquidity drain behind the selloff? Not in the Fed data: net liquidity is ~$5.84T, about where it was in June.
What rose is the price of money. This year:
• 2Y yield +1.3 pts, to 4.8%
• $DXY +5%, highest since Mar 2025
Markets looked through it until October. $BTC $QQQ
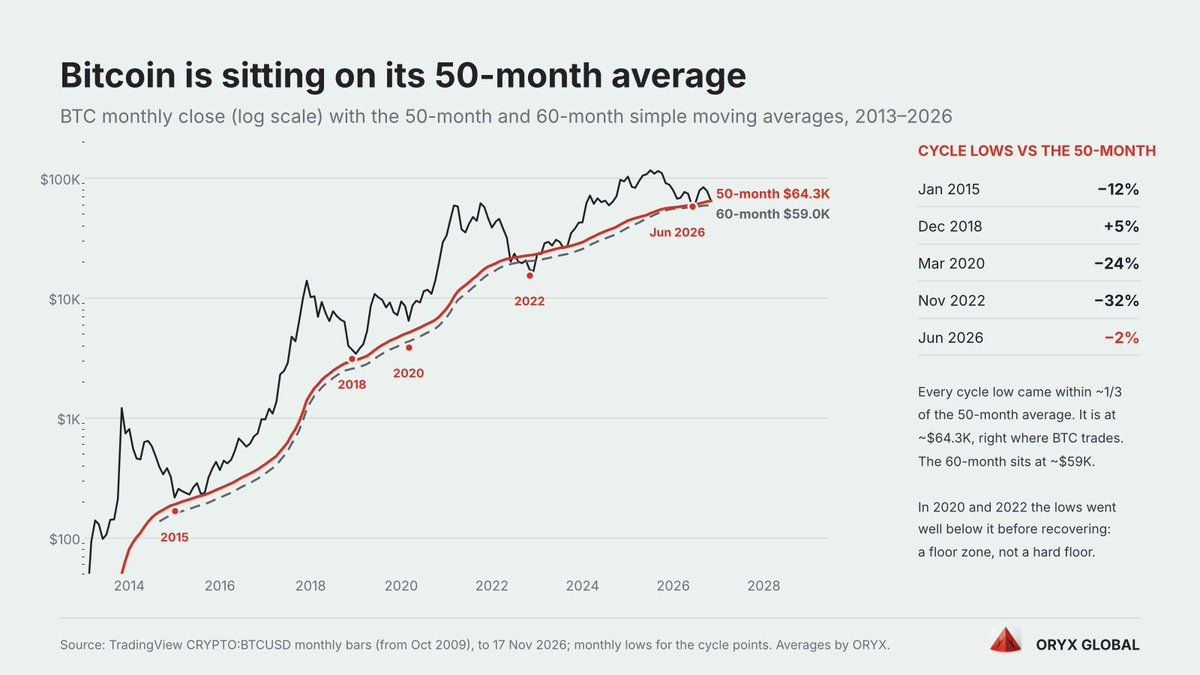
@KeithMcCullough $60K is also roughly where the 60-month average sits (~$59K). The 50-month (~$64.3K) is the one being tested now.
For context, cycle lows vs the 50-month: 2018 +5%, 2020 −24%, 2022 −32%, Jun 2026 −2%.
$BTC
@virtualbacon Same zone the long averages point to: the 50-month sits ~$64.3K (where BTC trades now), the 60-month ~$59K, right by that 60K strike.
Past cycle lows landed 5% above to 32% below the 50-month, so it makes sense protection clusters there.
$BTC
@Cryptoze 1,700 days is ~56 months, so that line sits between the 50-month (~$64.3K) and 60-month (~$59K) averages.
On monthly lows it has been a zone more than a line: 2018 bottomed +5% above the 50-month, 2020 −24% and 2022 −32% below it before the turn.
$BTC
Bitcoin is sitting on its 50-month moving average, ~$64.3K.
Cycle lows vs that line: 2015 −12%, 2018 +5%, 2020 −24%, 2022 −32%, Jun 2026 −2%. A floor zone, not a hard floor.
The 60-month sits just below, at ~$59K.
$BTC $IBIT
@Cryptokiwi15@Cointelegraph@glassnode Not that we've seen. We only have his 14 Nov reading (~$83K), so no time series to test it against yet. We'll track it from here.
The best source is the author: @biancoresearch, does your ETF cost basis remove outflows at average cost or at that day's price?
@Cryptokiwi15@Cointelegraph@glassnode It depends on the accounting, and we don't know Bianco's exact choice:
- Outflows removed at the running average cost: the average stays put.
- Outflows netted at that day's price: selling below cost nudges the average up.
Either way, outflows below ~$83K don't pull it down.
@jebra333@WhaleScan Yes, from each cycle's all-time high: 17 Dec 2017, 10 Nov 2021, 6 Oct 2025.
The halving link sits before that: those highs came ~17-18 months after the 2016, 2020 and 2024 halvings. The lows then came ~12 months after the highs. This time we're past that.
Good question. It's Bianco Research's estimate: as we understand it, each day's net ETF flow is priced at that day's BTC price, so it's a flow-weighted average of net inflows, not of trading volume. Method choices shift it a little, so read ~$83K as a ballpark, not a precise line.
@velo_xyz And it hit on a weekend. Saturday's Binance spot volume was 28.4K BTC vs 5.2K the Saturday before, with no US ETF bid until Monday.
Weekly close $65.4K: under the 200-week avg ($67.8K), above the $62.3K August low. $BTC
$BTC weekly close: $65.4K, -12.7%.
Below the 200-week avg ($67.8K) for the 3rd time in 2026. The first two were reclaimed the next week.
Demand gauges:
- Stablecoins $244bn, -$12bn in a month
- BTC ETF assets $98bn, from $108bn
- Fear & Greed 13
This week is the test. $IBIT
Stablecoins are crypto's money supply.
USDT + USDC: $268bn in May, $244bn today. Past month: -$12bn. Glassnode: fastest drop since June 2022.
The Fed is tightening, and so is crypto's own M2.
Halvings set supply. Liquidity sets price.
$BTC $USDT $COIN
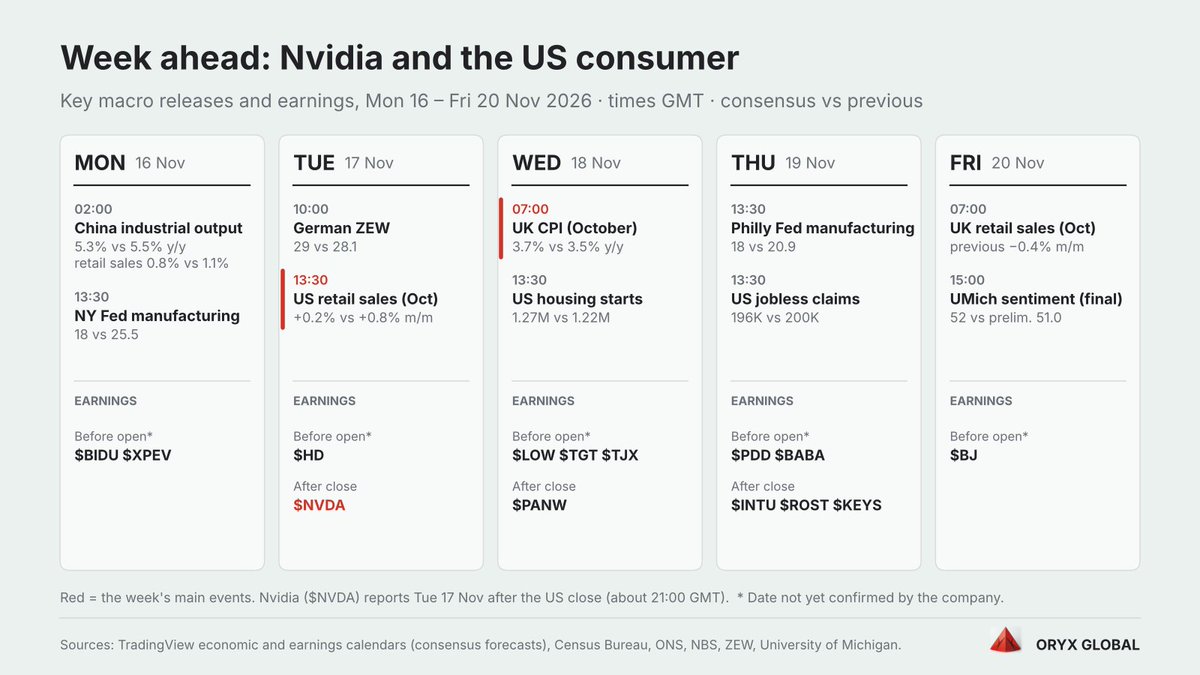
Week ahead:
Mon: China activity data
Tue: US retail sales, then $NVDA after the close
Wed: UK CPI; Target, Lowe's, TJX
Thu: Alibaba, PDD, Intuit
Fri: UMich sentiment
The AI trade and the US consumer, tested in the same week.
$TGT $BABA