Father of 3, Husband to my beautiful wife, Shari, Firefighter/Paramedic, Owner PM Siding, Cleveland sports fan, weather junkie, Snowboarder 🏂,Average Poker plr
In case you needed more evidence that the Steelers are the dirtiest team in the league. Number 67 is trying to end careers. They did Nick Chubb the same way, diving at knees from the side.
One of the worst heatwaves on record in the southern U.S. occurred during this week in 1925.
Temperatures from Texas to Virginia reached the triple digits. Ten U.S. states set their “all-time” September monthly high temperature records: AL (112°), AR (113°), FL (106°), GA (111°), IN (108°), KY (112°), MS (111°), MO (110°), SC (111°), and TN (112°). Illinois tied their state September record high maximum of 109° on the 5th in Harrisburg, which had previously been set on September 3, 1913, at the same location.
Centreville, AL's 112° reading is actually the statewide “all-time” high temperature record for any month, an incredible feat. It's actually the only statewide record high to not be set during meteorological summer.
Huntsville recorded 12 days at or above 100° during September 1925 (seven of which were consecutive from September 3–9th), peaking at 108° on the 7th. Huntsville hasn't reached the triple digit mark at all so far this year (and it's unlikely to at this point), and for perspective, it has only reached the mark nine times during September in the last 70 years. Only two of those have been in the 21st century (both in 2019).
Birmingham also recorded 12 days with highs in the triple digits during September 1925, peaking at 106°F on both the 5th and 6th. For perspective, Birmingham hasn't hit 100°F during September since 1990.
If this happened today, the frauds working for World Weather Attribution (WWA) would conduct a “rapid extreme event attribution study” claiming that this is “virtually impossible without oil companies' sins.”
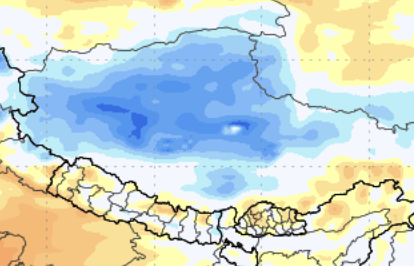
The Horrific dam burst was not caused by climate change. In fact, temperatures have been running below normal in Tibet and near normal in Nepal. The source is geological, not meteorological
The Horrific dam burst was not caused by climate change. In fact, temperatures have been running below normal in Tibet and near normal in Nepal. The source is geological, not meteorological
I think that Trump renaming Lake Ontario to Lake America is pointless and stupid.
Wanna know what else I think is dumb?
The fact left-wingers are triggered about this after they spent the last decade plus renaming sports teams, public schools and universities, streets and highways, food and condiment brands, and redefining half the dictionary altogether.
Here’s a list of some in case you forgot:
• Washington Redskins ➡️ Commanders
• Cleveland Indians ➡️ Guardians
• Stanford Indians ➡️ Cardinals
• Loudoun County Raiders ➡️ Captains
• Edmonton Eskimos ➡️ Elks
• Columbus Day ➡️ Indigenous Peoples’ Day
• Lee–Jackson Day ➡️ eliminated
• Robert E. Lee High School ➡️ John Lewis High
• Jefferson Davis Highway ➡️ Richmond Highway
• Mount McKinley ➡️ Denali
• Fort Bragg ➡️ Fort Liberty
• Fort Hood ➡️ Fort Cavazos
• Boy Scouts of America ➡️ Scouting America
• Aunt Jemima ➡️ Pearl Milling Company
• Uncle Ben’s Rice ➡️ Ben’s Original
• Eskimo Pie ice cream bars ➡️ Edy’s Pie
• Land O’Lakes ➡️ removed the Indian, but kept the land
• Illegal alien ➡️ undocumented worker
• Hispanic ➡️ Latinx (a term Hispanics did not want and do not use)
• Mother ➡️ birthing person
• Anchor baby ➡️ child of noncitizens
• black ➡️ Black
• Breastfeeding ➡️ chest feeding
• Inmate / prisoner / convict / felon ➡️ justice-involved person
• Ex-con / ex-felon ➡️ returning citizen
• “Gender” as a biological fact interchangeable with “sex” to being a social construct
• Fat ➡️ plus-sized
• Master bedroom ➡️ primary bedroom
• Manhole ➡️ utility hole
And so on and so on. . .
Summer has failed to arrive in the High Arctic.
Danish Meteorological Institute data show June 2026 averaged -2.2C (28F), by far the coldest June in record books extending back to 1958.
And the cold continued through July.
By July 27, the monthly mean stood at just 0.01C, effectively freezing. Temperatures repeatedly fell below 0C during what should be the warmest part of the Arctic year, when readings normally climb to 2C or higher.
A review of the DMI archive reveals no colder summer run, with 2026 tracking at the bottom of the entire 69-year series.
While headlines warn of an overheating Arctic, the region north of 80N has been the coldest we've ever known it in archives dating back to 1958.
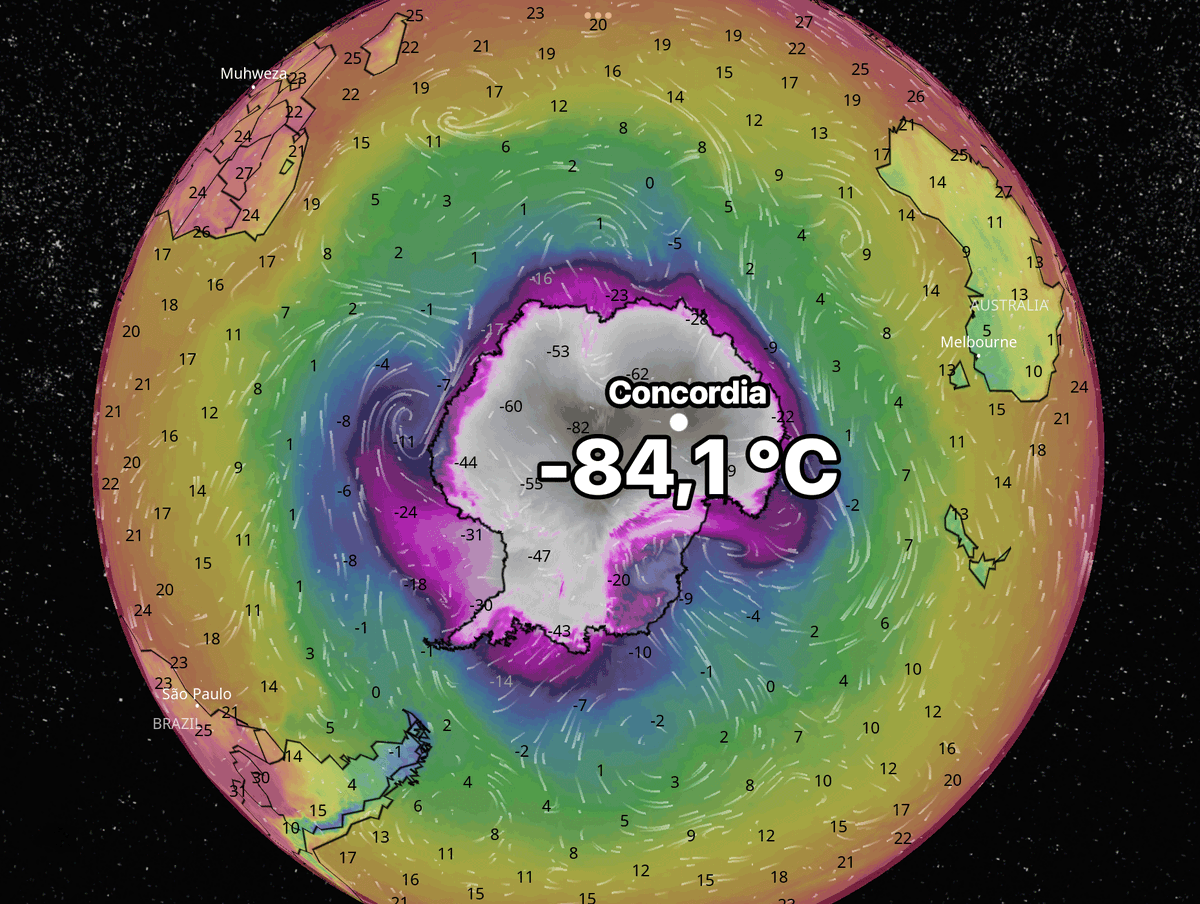
The temperature at Antarctica's Concordia Research Station dropped to −84.1 °C on Saturday, July 18. 🧐 It was the lowest temperature recorded anywhere on Earth since 2012. 🥶
We are being told that the wildfires in Ontario are being driven / fueled by climate change. Specifically, more extreme heat and increased drought. So, unlike the journalists and most meteorologists regurgitating these talking points, I looked at the actual data since 1910.
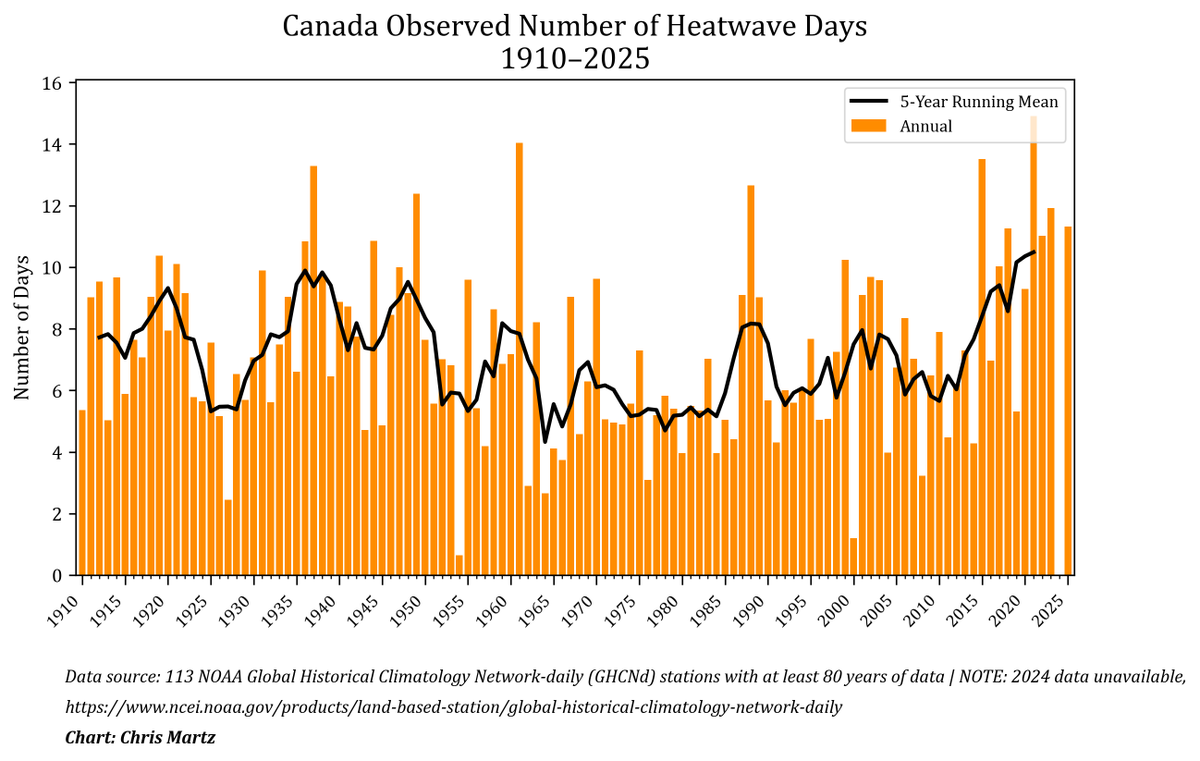
The average number of heatwave days (HWDs) in Canada (which are defined as ≥3 consecutive days with Tmax ≥90th percentile against the 1991–2020 mean per station) was 8.58% lower during the 60-year period 1965–2025 compared to 1911–1960, but the linear trend is not statistically significant at the 95% confidence level. The last eight years have exhibited an unusually high number of HWDs, but it's far too early to tell if that's a sign of things to come or simply an artifact of natural variability. I used 113 long-term (≥80 years of daily data) GHCNd stations to complete this analysis. The only way one can get a meaningful increase in HWDs is to cherry-pick the x-axis starting date and ignoring pre-1960 data.
Looking at droughts, I examined the self-calibrating Palmer Drought Severity Index (scPDSI) from CRU (data is available through 2024). I then calibrated that to the Drought Monitor over the same period that I analyzed HWDs. There isn't much of a trend there; in fact there is a significant decrease in the worst of the drought categories despite the spike in 2023–24.
Very few people these days in this line of work build datasets from scratch. But I do it because if someone makes a claim, it's very easy to test said claims against observational data. In most cases, alarmist narratives crumble with scrutiny. While alarmists get the basics right about the physics of Global Warming Theory in an “all else being equal” hypothetical, the real-world is a far more complex and details are hairy.