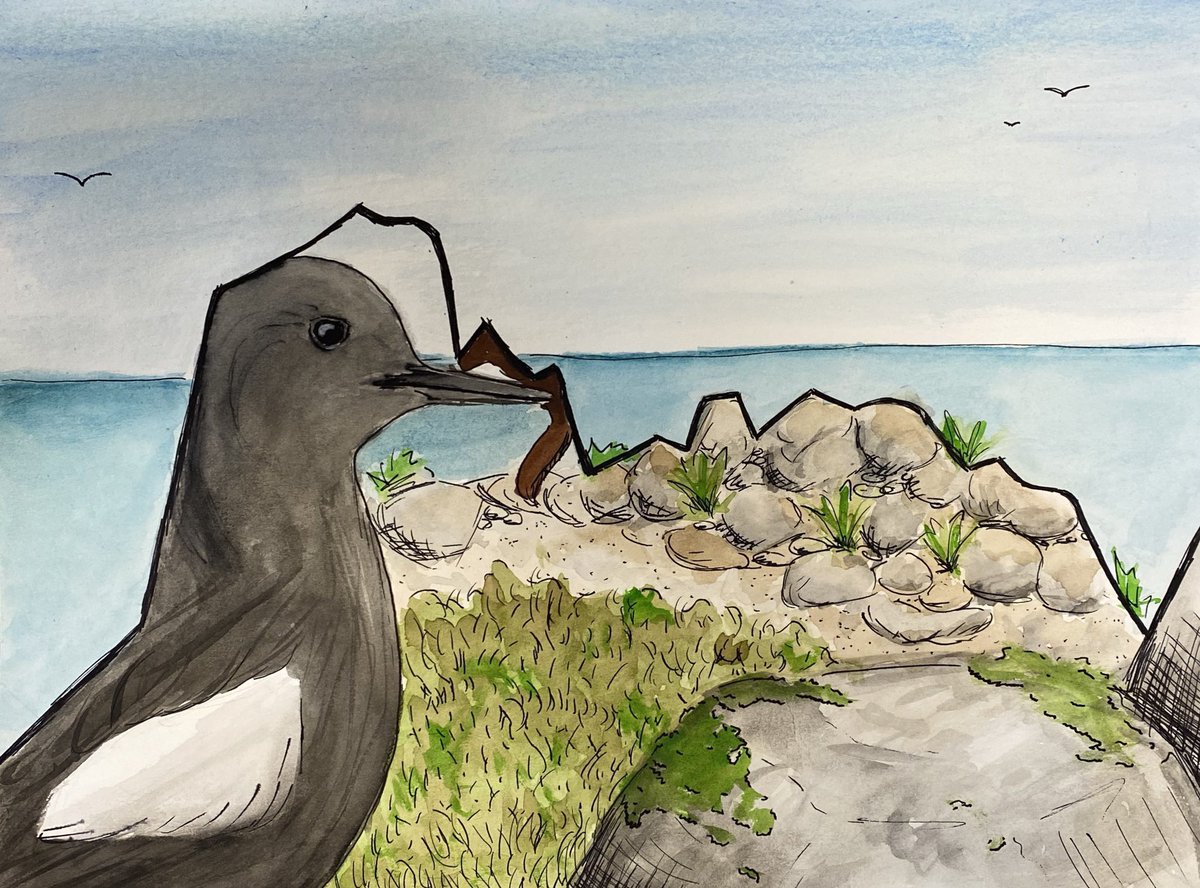
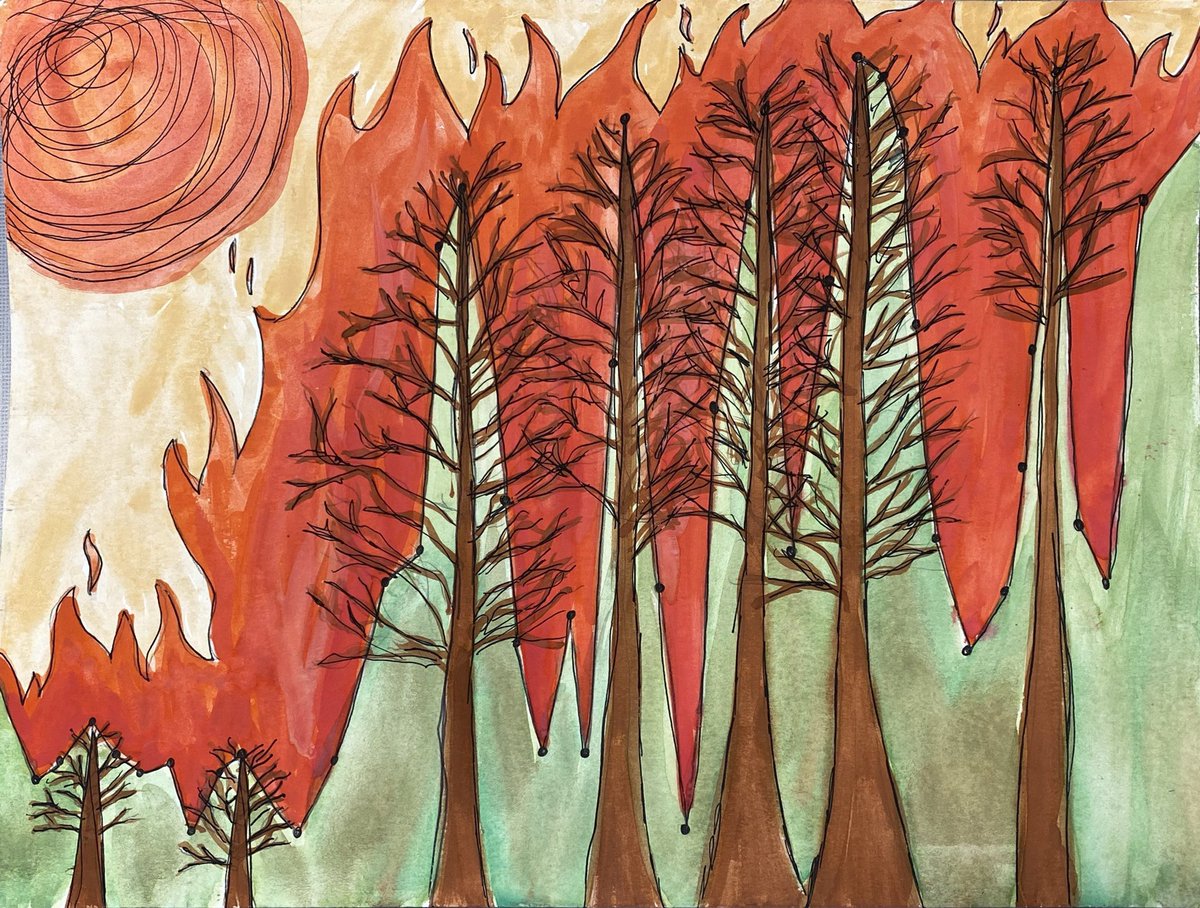
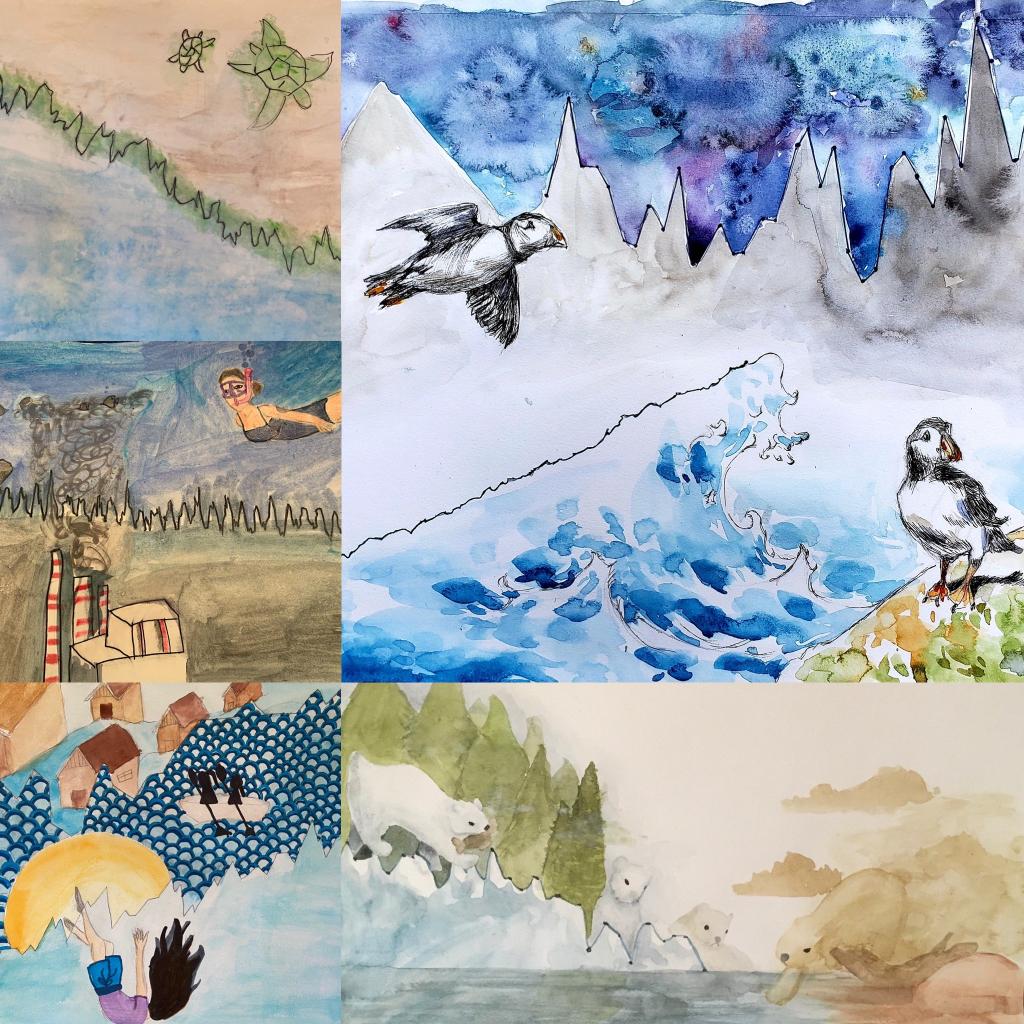
I was so impressed with my students’ final projects this semester using watercolor art to illustrate climate change related graphs. The assignment is based on Jill Pelto’s work @GlaciogenicArt and Ryan Becker’s @scifri lesson (https://t.co/dg0XRj9kj8) @app_earth_sci@AppStateCAS
Can you spot the line graphs? #NatGeoCertified T @CVeresan's 5th graders incorporated scientific data into artwork about climate change.
Scientist-artist @GlaciogenicArt provided inspiration & guidance. Lesson by @Physci8 for @scifri. #STEAM
🎨 : Courtesy of Cristina Veresan
@CVeresan @AnikaMBrandt @EllieInSpace @scifri Thanks so much! I always enjoy seeing the care and creativity evident in your Ss illustrated graphs. Awesome that you Zoomed with @GlaciogenicArt, too!
Awesome #sciart by Ss in @AnikaMBrandt & @CVeresan's classes! Inspired to share our recent use of transit data from the exciting exoplanet discoveries of @EllieInSpace. See full @scifri#illustratedgraph lesson at https://t.co/2jo53oj6gC
@CVeresan @GlaciogenicArt@scifri@nuevaschool These are fantastic! I love the diverse settings represented as well as the incredible artistic creativity. Please let your students know how impressed I am with their work! @Arieloquent@msxgarcia, can we add this to the gallery at the end of the resource?
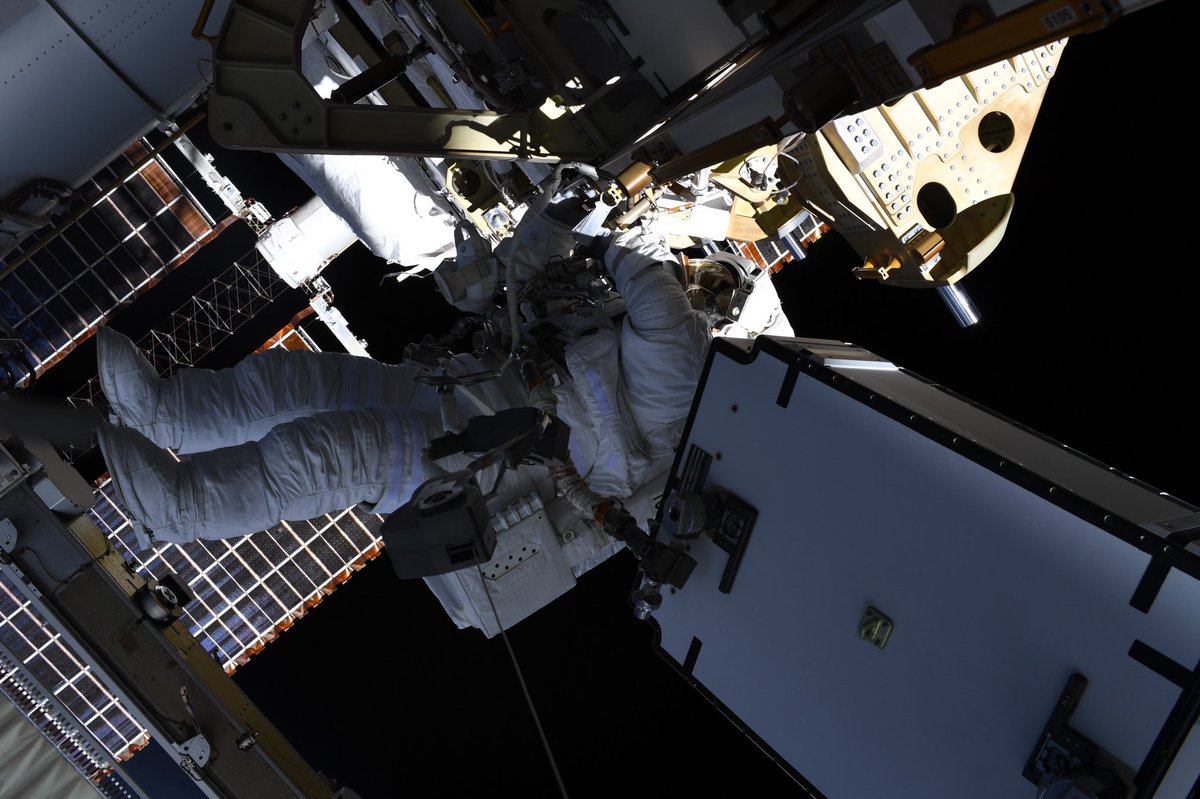
Everyone knows @Astro_Christina & I went for a spacewalk on Friday. But do you know why? With the support of @NASA_Johnson teams, we replaced the BCDU to bring @Space_Station power back to full capacity. We hope Friday’s adventure invigorates the power of all who dare to dream!