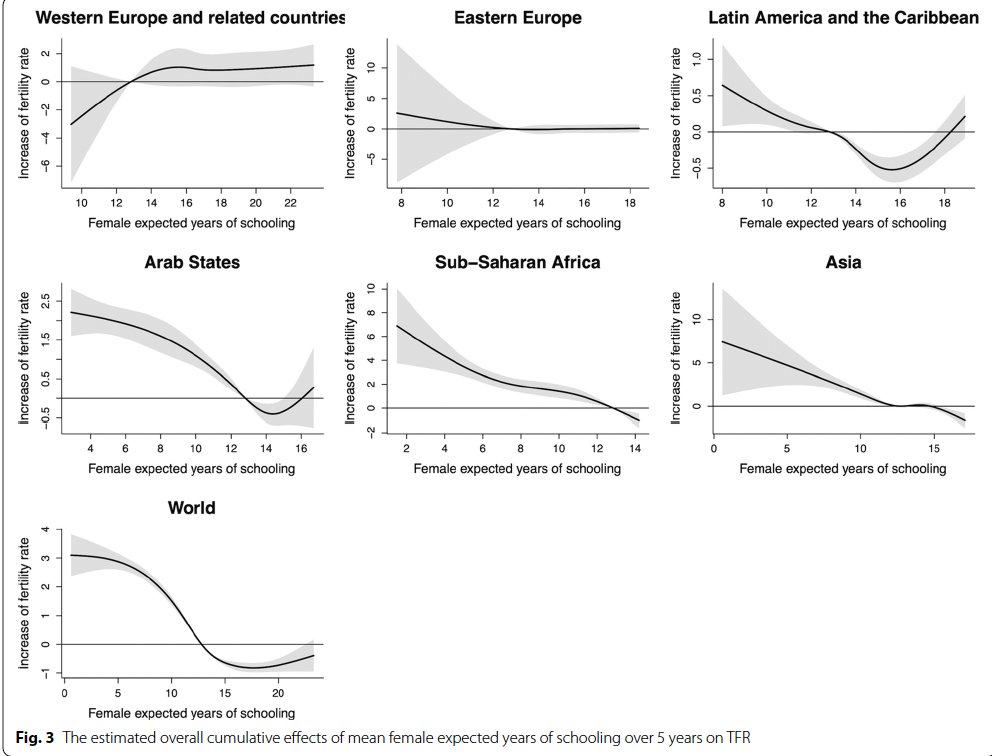
This figure comes from a recent paper by Cheng et al.
https://t.co/1oW5QjGAui
that correlates several statistical measures of income, social outcomes, and related variables with total fertility rates (TFR).
The figure shows the relationship between the estimated overall cumulative effects of the mean female expected years of schooling over 5 years on TFR across regions.
Right off the bat, let’s recall that this is a relation, not a causality statement. It does not say that education causes higher or lower TFR; it only states that education and TFR move together. For example, the causality arrow could move in the opposite direction: because teenage pregnancies are rarer now, thanks to easier access to contraception, more women can continue their studies.
Nonetheless, we see two patterns in the figure. One for Western countries with a positive slope and one for the rest of the world with a negative slope.
There are two interpretations of this difference.
Interpretation one is that Western countries are “different” from the rest for unspecified reasons.
Interpretation two is that Western countries are the “future of the rest”: that, as the “package of modernity” arrives in a country, education and fertility start moving together in a positive way. If you break down the other regions of the world, which are quite coarse, into subgroups, you see a pattern closer to that of the Western countries in those more advanced subareas.
Increasingly, in rich economies, having kids is becoming the ultimate status symbol: one of the few things that one cannot “imitate” with a cheap substitute in Ikea or on social media. The social consequences of such change will be quite significant.
And my hypothesis is that the rest will follow the West. After all, Horace already taught us that mutato nomine de te fabula narratur.
@piotr_mosak Wysokość wynagrodzeń wynika z kapitałowego uzbrojenia pracy czyli tego ile kapitału zostało zakumulowane i zainwestowane w nowoczesny przemysł, potem place w usługach rosną zgodnie z efektem Baumola. Niesamowite jak wy nic nie wiecie o ekonomii, a ciągle się wypowiadacie.
@grzybowski__ Ok tylko co w zamian poza zwiększaniem wydatków bo wydatki to będą rosły i rosły przy starzejącym sie społeczenstwie więc musimy mieć bardziej efektywny system.
@piotr_mosak@partiarazem A jaki poziom produktywnosci mają kraje w których pracuje sie najkrócej ? I jaki czas pracy mają kraje o zblizonym do Polski poziomie produktywnosci ?
@iggnacy Bo tylko techno-fantasci wierzą w jakieś dwucyfrowe wzrosty, to nie jest nawet fizycznie możliwe. Ludzie nie rozumieją, że obecny wzrost nie jest naturalny i samoistny, a podtrzymujemy go dzięki ciągłemu postępowi technologicznemu.
@kezsunaj@mmpiatkowski Pułapka sredniego dochodu dotyczy zupełnie innego zagadnienia niz sspowolaniajace tempo konwergencji. Poza tym według samych autorów tego pojęcia ta pułapka dotyczy krajów o dochodach które Polska przekroczyła kilkanascie lat temu.
@FinansowyUmysl Moim zdaniem ciężko będzie nawet o skromny. Ludzie nie rozumieją, że tempo wzrostu które mamy nie jest czyms naturalnym i samorzutnym, ale to ciągłu postęp technologii pomaga je utrzymać.
@micha_mozdzen Liczę na to, ze teraz robia małe podwyzki zeby w 2028 zaproponowac bardzo dużą. Informacja pojawiła by sie we wrzesniu 2027, tuz przed wyborami.
Over the weekend, I wrapped up a new version of my paper “The Neoclassical Growth of China” with Lee Ohanian and Wen Yao:
https://t.co/KVtWwTOVjY
The main change from previous versions is that we thoroughly redid the analysis using PWT 11.0. This was important because it allowed us to extend the sample to 2023. The additional years are quite informative, although to our pleasant surprise, in full agreement with what the model in the previous version of the paper had predicted using data up to 2019.
I include my favorite figure from the paper in this post, which compares China with other East Asian economies at similar income per capita levels.
To do so, we identify the year in which each of China, Korea, and Taiwan reached Japan’s 1950 per capita income level; the earliest year available for Japan in PWT 11.0. Japan's income per capita in 1950 was $3,138 (2021 PPP dollars), matching China’s in 1995, Korea’s in 1972, and Taiwan’s in 1961. Also, this initial per capita income of $3,138 is close to the middle-income threshold ($3,000) used by many international institutions and statistical agencies.
We then trace the evolution of GDP and investment for each economy from that point onward.
What do we see?
First, China’s growth since 1995 has been remarkably similar to that of other East Asian economies when they were at the same level of GDP per capita, even though the distance to the technological frontier (proxied by the U.S.) was larger for China than for other East Asian economies because China took off later.
Second, the growth pattern of all East Asian countries is amazingly similar.
Third, in this pattern, there is a clear slowdown in growth once a country gets to around two-thirds of U.S. income per capita. While China might depart from the growth pattern of other East Asian countries in the future, there is absolutely nothing in the growth data to suggest this has happened so far.
We tried all the variations of the same figure one could imagine. Some are in the paper, some got “cut” from the draft. But the main point is sharp: China is different because of its population size, not because of its growth pattern.
Personally, I also think this graph shows that the burden of proof lies with those who argue that China’s future growth will differ from that of other East Asian economies.
With a total fertility rate of 0.93, my bet is that China’s growth future will not be that different from Japan’s present.
Co zawód radiologa mówi nam o rewolucji technologicznej?
W 2016 r. Geoffrey Hinton, informatyk i laureat prestiżowej Nagrody Turinga, wygłosił odważną tezę: przestańmy szkolić radiologów, bo ten zawód niebawem przestanie istnieć.
Hinton uzasadniał to rosnącą liczbą urządzeń medycznych bazujących na AI, które miały w pełni zautomatyzować pracę radiologów. W 2017 roku pojawił się np. CheXNet, czyli model wytrenowany na zbiorze 100 tys. zdjęć rentgenowskich potrafiący zdiagnozować zapalenie płuc precyzyjniej niż zespół certyfikowanych specjalistów.
Czy rynek radiologów od tego czasu rzeczywiście przeszedł falę automatyzacji? Nie.
Płace realne wzrosły, zatrudnienie też, wskaźniki wakatów osiągnęły rekord. Na rynku jest niedobór radiologów, a w 2025 r. zawód ten stał się trzecią najlepiej opłacaną specjalizacją w USA.
Więcej 👉👉👉 https://t.co/CWlICVtYh0
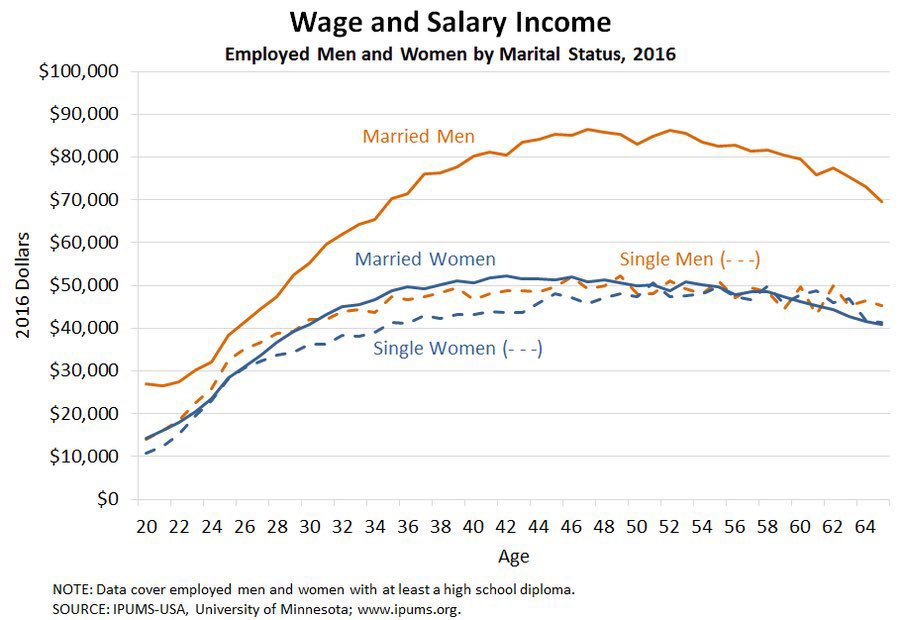
Eye-opening chart: there is no such thing as a gender pay gap. It’s married men making more than everyone else.
What is causing such divergence? Are married men simply more responsible and hard-working, or is it something else?
@OlgaEwaSemeniuk Ale do kogo Pani pisze ? Tu raczej nikt albo mało kto ma firmę z przychodami powyżej 50 milionów euro albo ma dochody powyżej miliona zł.
@ELITA_NA_JDG Nie wiązałbym go z ASE. Nie wiązałbym go z żadną szkoła, ani w ogóle ekonomia. Rozumiem, że nie zgadzacie się z ASE, ale nie każdy tłuk mówiąc, że wolny rynek jest ok to odrazu ASE. Ten Pan nie wiele wie o ekonomii ogólnie, a co dopiero o konkretnych szkołach.