OPENING RANGE CLOSE: Today's 30-minute ORC was near the top of its range as well as above yesterday's high. Combine that with negative market breadth data (as measured by ($ADD) and ($VOLD)), and you have a very notable divergence! After breaking below this level, ES retested it (to the tick!) before resuming its decline.
$ES #ES #ES_F $SPY #SPY $SPX #SPX #AlgoTrading #SystemTrading #SystematicTrading #StrategyTrading #DayTrading #TechnicalAnalysis #OpeningRange
OPENING RANGE CLOSE: After yesterday's multi-day price high, ES gapped down at the open accompanied by very negative market breadth. After the initial move down, ES retraced enough the retest the 5-min ORC (to the tick!) before resuming a 40+ point move to the downside.
$ES #ES #ES_F $SPY #SPY $SPX #SPX #AlgoTrading #SystemTrading #SystematicTrading #StrategyTrading #DayTrading #TechnicalAnalysis #OpeningRange
OPENING RANGE CLOSE: After putting in a multi-day high yesterday, market breadth (as measured by ($ADD)) was both below today's open and below yesterday's low as ES tested the 60-min ORC as resistance, well above yesterday's daily high. This extreme divergence presented traders with an interesting opportunity for a higher-odds short entry.
$ES #ES #ES_F $SPY #SPY $SPX #SPX #AlgoTrading #SystemTrading #SystematicTrading #StrategyTrading #DayTrading #TechnicalAnalysis #OpeningRange
OPENING RANGE CLOSE: Today's 30-min ORC proved to be solid support for ES as market breadth marched to new highs of day. This followed several consecutive days of weaker breadth.
$ES #ES#ES_F $SPY #SPY $SPX #SPX#AlgoTrading#SystemTrading#SystematicTrading#StrategyTrading #DayTrading #TechnicalAnalysis #OpeningRange
DAILY PIVOT (CUSTOM) : This variation of the popular daily pivot point uses 2x today's open in place of 1x the previous day's close - (yesterday's high + yesterday's low + today's open + today's open) / 4. This level has been featured here previously on 3/26/26, 11/6/24, 9/20/24, 8/29/24, 8/20/24, 6/28/24 and 3/15/24 as well.
$ES #ES #ES_F $SPY #SPY $SPX #SPX #AlgoTrading #SystemTrading #SystematicTrading #StrategyTrading #DayTrading #TechnicalAnalysis #PivotPoint
OPENING RANGE CLOSE: Today's 30-minute ORC was tested successfully as resistance (to the tick!) after ES reversed to the downside during the 'am reversal' time window of around 10am (ET). This followed a day of extreme high market breadth (a multi-day high) as measured by ($ADD) and a dramatic decline in that data today.
$ES #ES #ES_F $SPY #SPY $SPX #SPX #AlgoTrading #SystemTrading #SystematicTrading #StrategyTrading #DayTrading #TechnicalAnalysis #OpeningRange
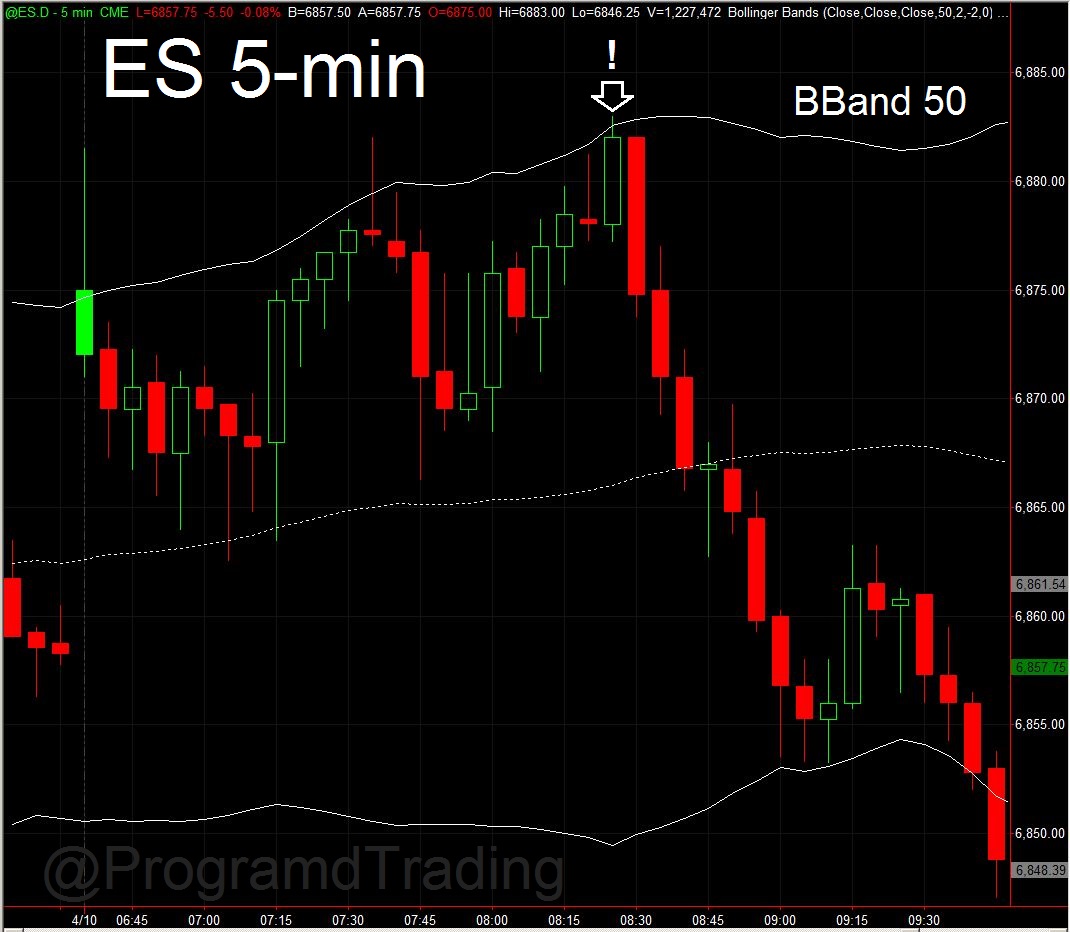
BOLLINGER BANDS: This example of ES testing it's upper BBand as resistance includes several additional bonuses. One is the failed breakout bar. The previous bar was red and this bar reversed back up taking out many stops in the process. Take careful note of this bar pattern as it happens over and over again at key reversals. One other is the fact that market internals were dramatically diverging from price. In this case, the intraday average of ($ADD) was at its low of day as price made a new high of day. Lastly, note the 3 topping tails on bars that recently tested this price area. The best trade entries occur when you can identify multiple factors that align simultaneously - aka the 'Preponderance of evidence'.
$ES #ES #ES_F $SPY #SPY $SPX #SPX #BollingerBands
PIVOT (CUSTOM): This variation of the daily pivot uses 2x the current day's open in it's calculation. The idea is to put emphasis on more recent price data: (Yesterdays High + Yesterdays Low + Todays Open + Todays Open) / 4.
$ES #ES#ES_F $SPY #SPY $SPX #SPX
OPENING RANGE CLOSE: The momentum behind this morning's opening gap up faded right as the 'am reversal' time window of approximately 10am (ET) began. ES then sank below it's 5-minute ORC before retesting it as resistance (to the tick!) a short time later.
$ES #ES#ES_F $SPY #SPY $SPX #SPX #OpeningRange
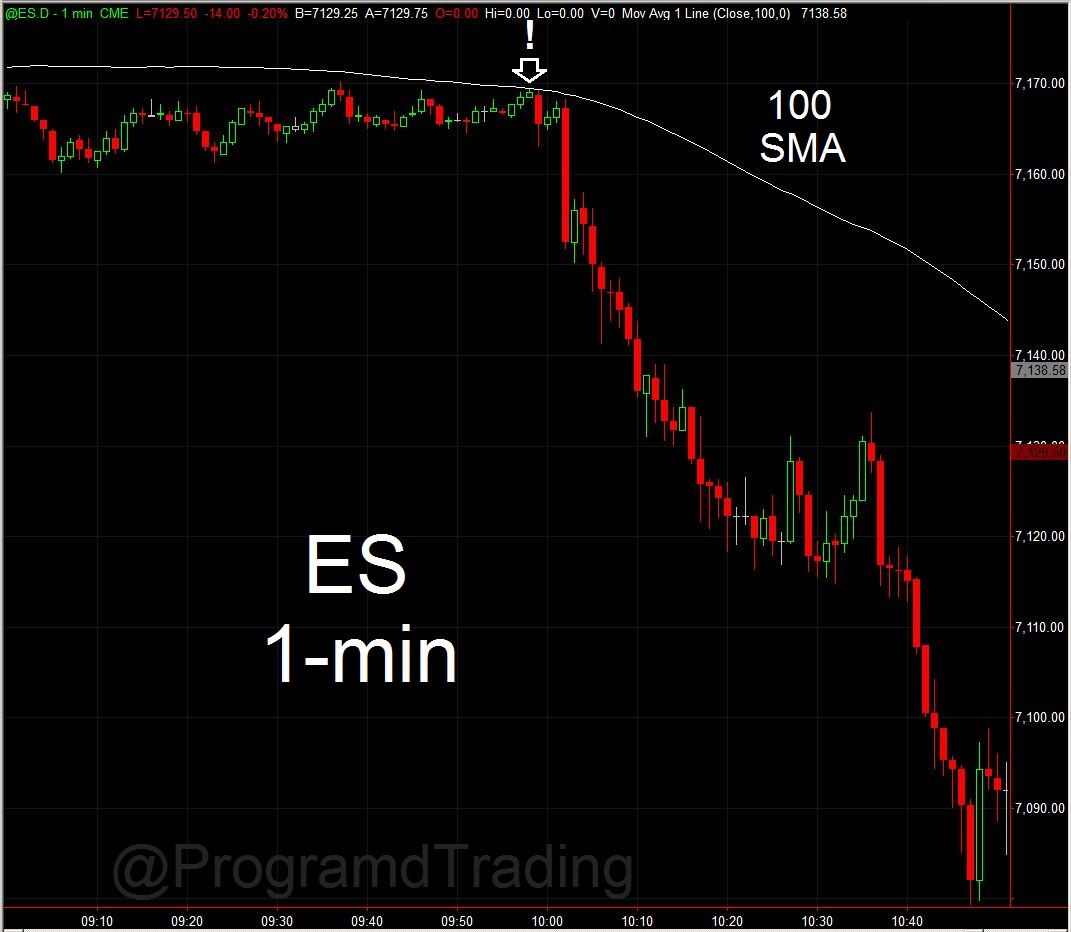
BOLLINGER BANDS: In the context of a downtrend (determined by the declining 50-period moving average here), ES tested its DECLINING upper BBand as resistance giving multiple potential short entry points. This example uses 0.5 standard deviations. BBands are among my favorite technical indicators and if you experiment with the settings and uses, you're likely to discover how brilliant they truly are!
#BollingerBands @BBands
BOLLINGER BANDS: ES formed a bottoming tail soon after the open right at its lower 50-period BBand (1 standard deviation). This coincided with a filling of the gap between todays open and yesterdays close. There are at least 2 other technical levels that were tested (successfully) as support in the first 30 minutes of trading. Do you see them?