Though 2020s and the 1960s and 1970s were very different, a key contributor to and effect of inflation in the second half of the 1970s was an increase in money velocity. M2 velocity is rising now. Comparisons of 1970s and now are strongly suggestive but not conclusive due to monetary developments over the past half century. See https://t.co/TrBjPtoyKz
One important difference between 2016 and 2024 is, in 2016 world net savings availability was on its way to peaking in 2017. Now it's arguably no higher and may be declining, causing the savings supply curve to move leftward and real rates to rise.
In 2016 the US - G10 differential was about 1.2 (rhs), and in 2024 the differential appears to be about 1.4 (lhs). The difference between 2016 and 2024 no doubt reflects tighter expected world net savings supply and demand conditions and/or higher expected geopolitical risk levels.
In the near- to medium-term, we can be quite sure that economies can't structurally change themselves very much, which means the world savings supply curve is slow moving and quite inelastic. However, because economies can change fiscal policies relatively quickly, the demand curve (debt issuance) can move rightward very quickly.
Supply curve inelasticity means rightward demand curve movement quickly drives up real rates. For less favored destinations, real rates will rise even higher. Could this be an aspect of your 2016 - 2014 comparison?
East Asian friends who were front-row witnesses of the disappearance of Bernanke's 1990s and 2000s "savings glut" insisted several years ago that we need to think about global rates within a net savings supply and demand framework. I described this view in "The Looming Global Savings Drought" for The International Economy.
In his "An International Approach to the Neutral Interest Rate" Andrés Blanco at the Atlanta Fed moves in this direction.
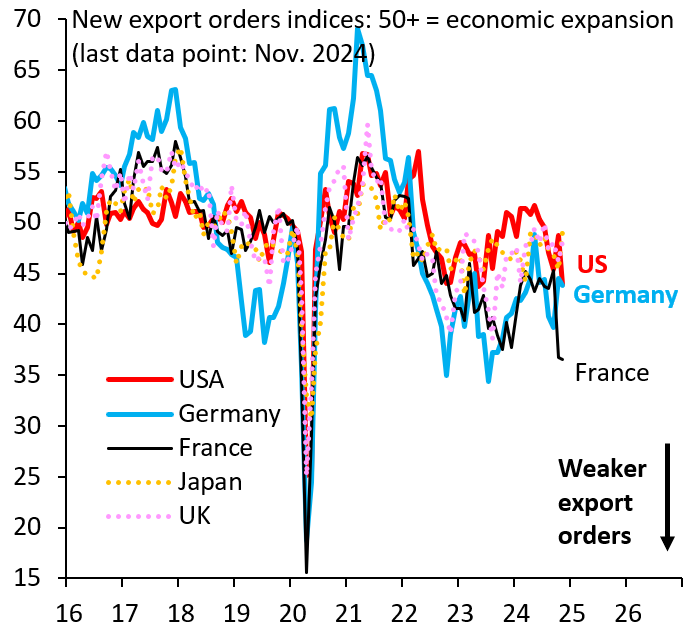
Something very bad is going on with France. Here's new export orders in the global manufacturing PMIs across key advanced economies. France (black) has been at 36 (50 is neutral) for two months now. There's lots of focus - rightly - on Germany's malaise, but not enough on France.
Con el tiempo, la entrada a los modelos de IA consistirá cada vez más en salidas de IA generadas previamente, lo que hará que la salida de IA refleje cada vez más entradas de IA anteriores. Esta circularidad podría introducir una forma de "deriva cognitiva" que consiste tanto en errores reflexivos como en sesgos cognitivos que reflejan el pensamiento humano. ¿Cómo podemos medir la presencia de una "deriva" en la producción de IA y, si nuestra confianza en la producción de IA disminuye, ¿cuándo deberíamos preocuparnos?
Perplejidad responde a esta pregunta de esta manera:
Según los resultados de la búsqueda y la información disponible, puedo brindar algunas ideas sobre la circularidad de la IA, la deriva cognitiva y cuándo deberíamos preocuparnos por la disminución de la confianza en los resultados de la IA:
Comprender la circularidad de la IA y la deriva cognitiva:
La circularidad de la IA se refiere al fenómeno en el que los modelos de IA utilizan cada vez más resultados de IA generados previamente como entradas a lo largo del tiempo. Esto puede conducir a una forma de "deriva cognitiva" en la que los errores y sesgos se amplifican a través de ciclos repetidos de contenido generado por IA que se utiliza para entrenar nuevos modelos de IA.
El concepto de deriva cognitiva en los sistemas de IA es análogo a cómo el pensamiento humano puede desarrollar sesgos y errores con el tiempo mediante el refuerzo de ideas existentes. A medida que los sistemas de IA aprenden cada vez más de sus propios resultados, existe el riesgo de agravar los errores y desarrollar perspectivas sesgadas que divergen de la realidad.
Medición de la deriva de la salida de IA:
Si bien no existe un método universalmente establecido para medir la desviación de la producción de IA debido específicamente a la circularidad, algunos enfoques que podrían usarse incluyen:
Monitoreo de distribución: compare las distribuciones estadísticas de los resultados de la IA a lo largo del tiempo para detectar cambios.
Seguimiento del rendimiento: supervise los cambios en las métricas de rendimiento del modelo, como exactitud, precisión, recuperación, etc., a lo largo del tiempo.
Técnicas de IA explicables: utilice métodos para analizar la importancia de las características y modelar la toma de decisiones para identificar sesgos emergentes.
Detección de deriva de datos: aplique técnicas como la divergencia de Kullback-Leibler, la divergencia de Jensen-Shannon, el índice de estabilidad de la población y las pruebas de chi-cuadrado para medir la deriva en las distribuciones de datos de entrada.
Cuándo preocuparse por la disminución de la confianza:
Deberíamos preocuparnos por la disminución de la confianza en los resultados de la IA debido a la circularidad cuando:
Hay una degradación significativa e inexplicable en el rendimiento del modelo con el tiempo.
El sistema de IA comienza a producir resultados que son inconsistentes con los hechos conocidos o el conocimiento experto en el dominio.
Hay evidencia de amplificación de sesgos o errores a través de ciclos repetidos de contenido generado por IA.
Los resultados de la IA se vuelven menos diversos y más homogéneos con el tiempo, lo que indica una perspectiva más estrecha.
Existe una divergencia notable entre los resultados de la IA y los datos del mundo real o el contenido generado por humanos en el mismo dominio.
Estrategias para mitigar riesgos:
Para abordar las preocupaciones sobre la circularidad de la IA y mantener la confianza en los resultados de la IA:
Implementar sistemas de monitoreo sólidos para detectar desviaciones y degradación del rendimiento.
Vuelva a entrenar los modelos periódicamente con datos nuevos y de alta calidad de diversas fuentes para evitar una dependencia excesiva del contenido generado por IA.
Utilice métodos de conjunto y múltiples modelos para realizar una validación cruzada de los resultados y reducir el impacto de los sesgos de los modelos individuales.
Incorporar la supervisión humana y la validación de expertos en los procesos críticos de toma de decisiones.
Invertir en investigación sobre la circularidad de la IA y desarrollar métricas y herramientas específicas para medir y mitigar sus efectos.
Equilibrar beneficios y riesgos:
Si bien la circularidad en los sistemas de IA plantea desafíos, es importante señalar que cierto grado de contenido generado por IA que se utilice como insumo para modelos futuros puede ser beneficioso. Permite la transferencia de conocimientos y la construcción de conocimientos previos. La clave es lograr un equilibrio e implementar salvaguardias para evitar la amplificación descontrolada de errores o sesgos.
En conclusión, a medida que los sistemas de IA se vuelvan más prevalentes y estén más interconectados, será crucial monitorear la deriva cognitiva debida a la circularidad. Debemos estar atentos a mantener la calidad y diversidad de los datos de entrenamiento de IA, implementar sistemas de monitoreo sólidos y combinar conocimientos de IA con experiencia humana para garantizar la confiabilidad y confiabilidad continuas de los resultados de la IA.
Correct. Yen weakness reflects the fact that Japan's bid for world net savings is not competitive yet. We're well past the "savings glut" years of the 2000s and mid-2010s. We're now in a net savings "drought" due to declines in China and other former strong savings exporting economies.
World investible savings are allocated by the intersection of net savings supply and demand. The clearing rate intersections form a savings-market yield curve. At this point, the savings-market yield curve is above Japan's. The yen won't stabilize until Japan's bid across the yield curve is equal or greater than world clearing rates.
The BOJ has to hike further and let the JGB yield curve become competitive. Domestic adjustment problems are unavoidable. But a sharp yen decline would arguably be worse. @federalreserve@benbernanke@LHSummers@elerianm@johnauthers@biancoresearch@josephwang@wbmosler@BobEUnlimited@DiMartinoBooth@michaelxpettis@Kotlikoff@B_Eichengreen@robin_j_brooks @WilliamGale2 @JulianMI2@HarryMelandri@greg_ip@RichMiller28
Is the "Dangerously" part of central bank rate decreases due partly to the decline in world net savings flows from high levels in the "savings glut" years from the early 2000s through late 2010s?
Bloomberg highlighted this problem with world savings flows in "Why the Cost of Money Is About to Go Up" in February --
https://t.co/KpcCfWxH6h
No doubt, allocation of world net savings is determined by a world savings market yield curve. How might the rise in this yield curve complicate central bank rate cut intentions?
Bloomberg reported on this question in --
"Global Savings Glut’s Demise Threatens Higher Borrowing Costs"
https://t.co/VQVQRhz1wj
@federalreserve@benbernanke@LHSummers@elerianm@johnauthers@biancoresearch@josephwang@wbmosler@DiMartinoBooth@michaelxpettis@Kotlikoff@B_Eichengreen@robin_j_brooks @WilliamGale2 @greg_ip@RichMiller28
But Robin, Fed rate cuts could be delayed for a broader reason. The world is a closed economy but the US is not. Fed policy is a dependent variable in the interaction between investible world savings supply, which is certainly not growing, and demand, which is (augmented especially by growing US deficits). @federalreserve@benbernanke@LHSummers@elerianm@johnauthers@biancoresearch@josephwang@wbmosler@DiMartinoBooth@michaelxpettis@Kotlikoff@B_Eichengreen
As Draghi explained last month at the DC NABE conference, fiscal deficits, and therefore the demand for savings, will increase for a variety of reasons in future years. As Auerbach and Kotlikoff in “The US Capital Glut and Other Myths” implied last August, the effects, if there were any, of savings gluts in the early 2000s and post-GFR are over.
As a result of the downturns in China and elsewhere, deglobalization, etc., we’re now in a kind of investible savings drought. And as I recently explained in “The Looming Global Savings Drought”, world savings supply and demand curves are very inelastic in the short and medium-term, meaning that increases in deficits that push the demand curve rightward, will drive world savings market clearing rates up rapidly. It was this interaction that drove US rates up in 2022 and 2023 beyond the calculations of economists who didn’t consider savings supply conditions.
Absent new sources of net savings, world real interest rates will be pulled steadily upward by the expanding deficits of major economies until structural fiscal reforms sufficient to halt the rise have occurred. For the next decade at least, I think we can ignore the possibility that nuclear fusion, quantum computing, or AI will magically make such reforms unnecessary.
In the real world, if world savings market clearing rates continue rising, the Fed will find it hard to cut rates and may have to steadily increase overnight repo operations to keep overnight official rates down where it wants them.
Central bank efforts to offset increases in world savings market rates with monetary accommodation will in time weaken their currencies, which will in turn put upward pressure on inflation.
Brad, can we get a sense of whether, or how much, the foreign demand was from low-income and middle-low income economies. I'm attempting to determine whether the strength of foreign demand represented capital outflows from weaker economies or maybe even capital flight responding to US rates and/or geostrategic risk.
See "Global Savings Glut’s Demise Threatens Higher Borrowing Costs"
https://t.co/VQVQRhz1wj
"The Looming Global Savings Drought -- Soon, Fed Chair Jerome Powell’s job will become a lot more complicated"
https://t.co/tkuzYm6q3N
Two problems with r* (1) Because it's dependent on variables that are not confidently known for at least a quarter, whatever r* is derived would likely be well after any policy could be implemented to respond to it.
Here's why. Tracking Holston, Laubach and Williams 2023 and data and code downloaded from the FRBNY, the model input data are:
o log of nominal GDP,
o PCE inflation,
o inflation expectations,
o oil price inflation, and
o the 3-mo Treasury rate
Using a Kalman filter, movements in real GDP, inflation, and short-term interest rates are converted into estimates of trend growth, the natural rate of output and the natural rate of interest (presumably the same 3-month maturity as the input data). The natural rate of interest, r∗, is the real interest rate consistent with output equaling its natural rate, y∗, and stable inflation. The output gap and inflation dynamics are modeled as a function of the real interest rate gap, r −r∗, using an intertemporal IS equation and a New Keynesian Phillips curve.
(2) It's unrelated to current world net savings and supply. Except for a small crack in the door of an intertemporal IS equation near the end of the r* estimation process, it's hard to see a way for actual world net savings supply and demand intersection to play a role in standard r* estimation. And if it does slip in, it would be after output and inflation had already been determined by actual world savings-market clearing rate yield curves.
For this reason, effective monetary and fiscal policy needs to include awareness of actual world savings and demand dynamics and actual market supply and demand determined clearing rates.
John Authers' article on Bloomberg today is important reading.
It continues a critical debate on whether ETFs distort stock pricing. The answer is generally yes -- and this is worrisome -- but the analysis toward the end under "Price Discovery" points to PE as a means to preserve the price discovery private market capitalism requires.
https://t.co/RIGJzrmeIJ
Over 100% of the Increase in Employment Since 2020 is Foreign Born https://t.co/nkkjeTZcaf We have an uncontrolled mess at the border. But the idea we need to round them all up in mass deportations is more than a bit crazy in the opposite direction.
Mass deportations would lead to the biggest labor shortage in US history for picking crops, working on construction, cleaning hotel rooms, etc.
Inflation would be far worse than anything we have seen yet.