No existe CANCER.
Lo que tiene es una gran infección parasitaria.
Recuérdelo siempre.
Cuando pronuncien la palabra C..., no se asuste, porque bajan la defensas y activa mas parásitos.
Solo preocúpese en desparasitarse. ese debe ser su objetivo.
Voy a escribir sobre las frecuencias para eliminar parásitos.
What Is Elliott Wave Theory?
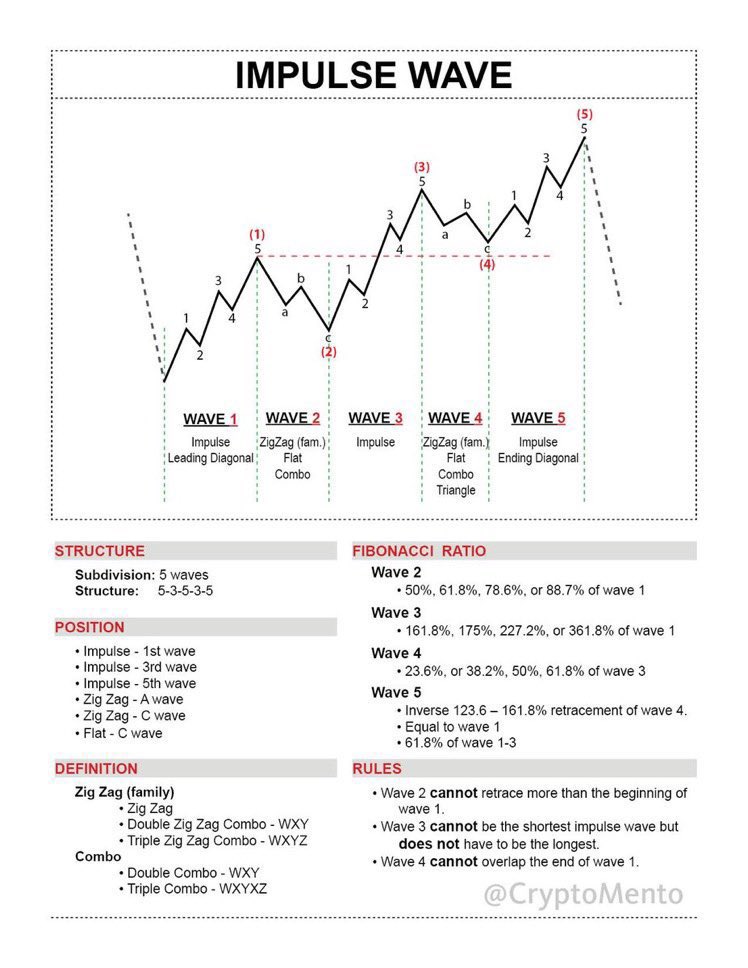
Elliott Wave Theory is a method of technical analysis that traders use to analyze and quantify price patterns in financial markets by looking at cycles. The theory believes that changes in investor sentiment and their psychology creates impulse waves and corrective waves inside the larger trends in market price action.
The theory attempts to forecast market trends by identifying the most extremes in trader���s collective psychology that create the highs and lows in price action.
Ralph Nelson Elliott developed the theory of the underlying principles and created the analytical tools back in the 1930s. He believed that prices in markets play out in specific wave patterns, which his followers call ‘Elliott waves’.
In 1938, he published this theory of market behavior in his book ‘The Wave Principle’. In 1946, he covered his Elliott Wave Principles most completely in his final book: ‘Nature’s Laws: The Secret of the Universe’.
Elliott wave analysts believe that each wave has its own characteristic, which usually is a reflection of the psychology of the current market move.
Understanding the characteristic is thought to be the key to the correct use of the Elliott Wave Principle.
Elliott Wave definitions below assume a bullish stock market; the characteristics apply as the opposite in bear markets.
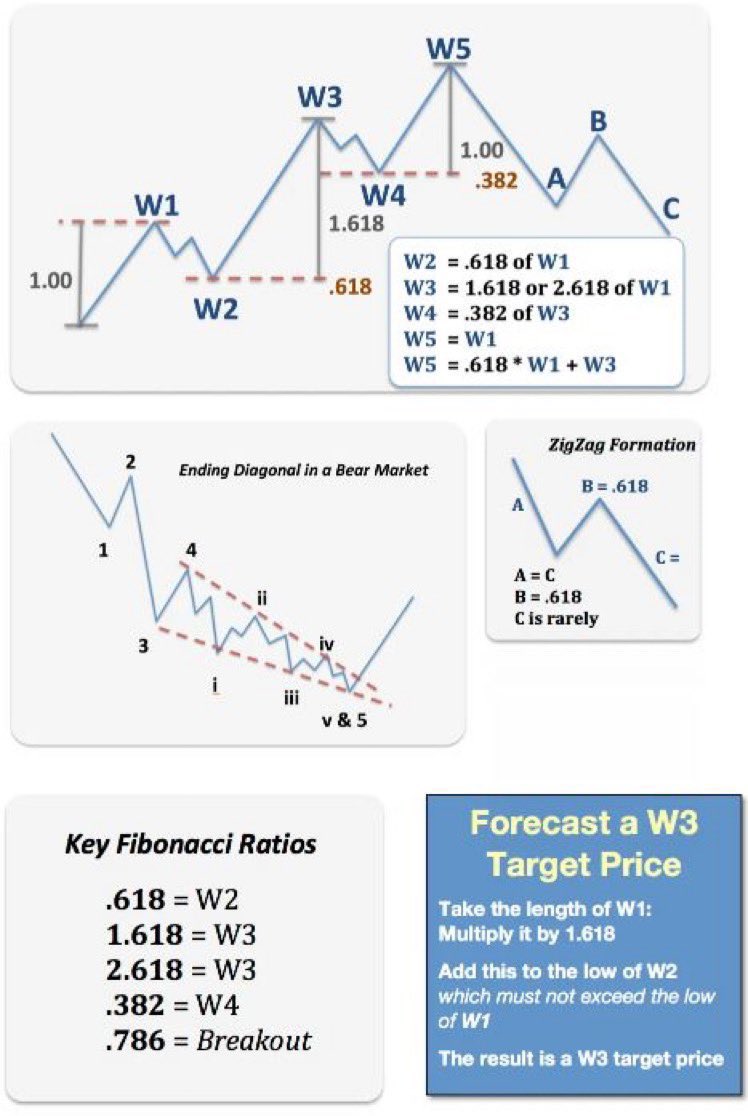
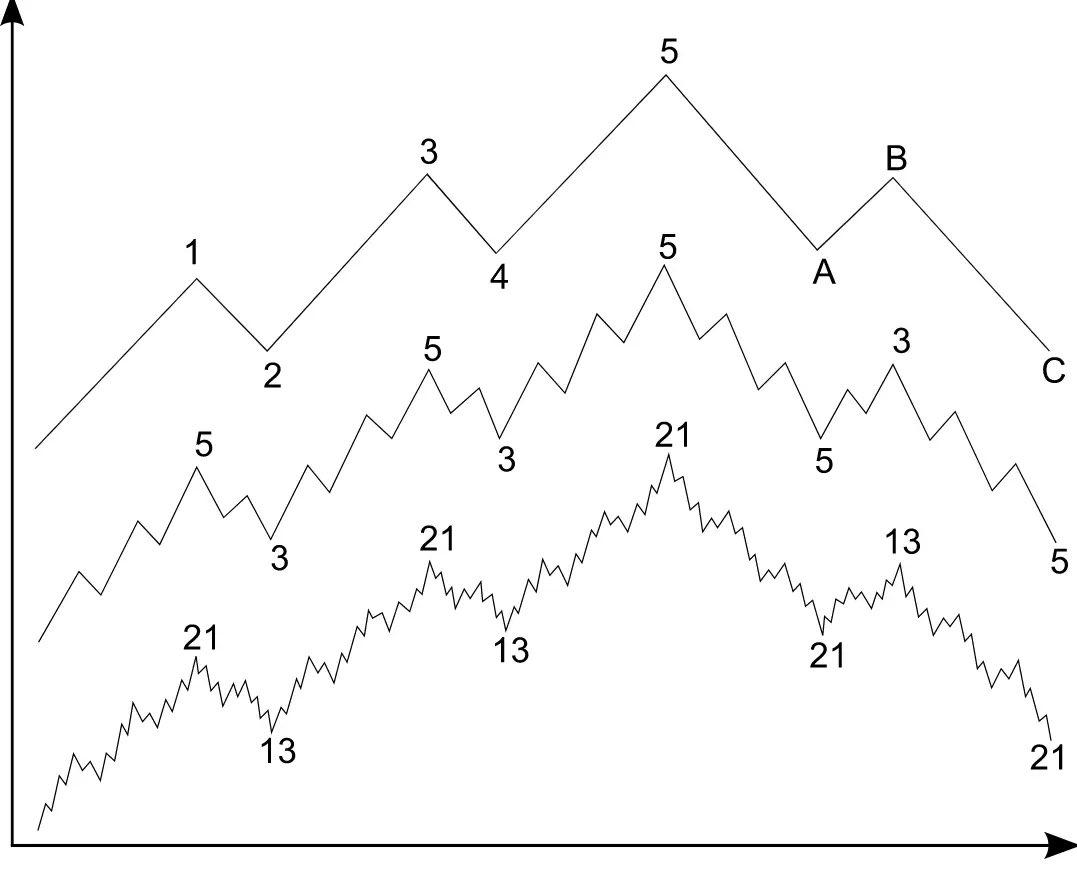
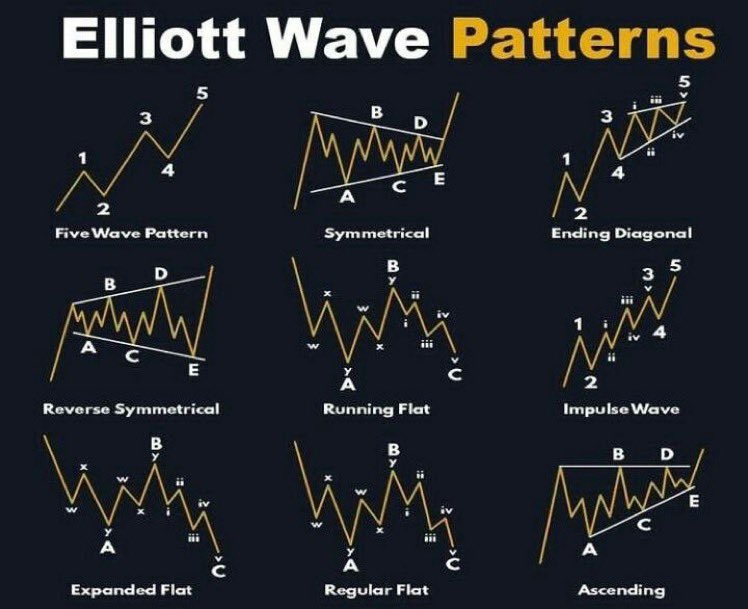
The five wave pattern inside the dominant market trend.
Wave 1: Wave one is rarely obvious at its inception. When the first wave of a new bull market begins, the fundamental news is almost universally negative. The previous trend is considered still strongly in force. Fundamental analysts continue to revise their earnings estimates lower; the economy probably does not look strong. Sentiment surveys are decidedly bearish, put options are in vogue, and implied volatility in the options market is high. Volume might increase a bit as prices rise, but not by enough to alert many technical analysts.
Wave 2: Wave two corrects wave one, but can never extend beyond the starting point of wave one. Typically, the news is still bad. As prices retest the prior low, bearish sentiment quickly builds, and “the crowd” haughtily reminds all that the bear market is still deeply ensconced. Still, some positive signs appear for those who are looking: volume should be lower during wave two than during wave one, prices usually do not retrace more than 61.8% of the wave 1 gains, and prices should fall in a three wave pattern.
Wave 3: Wave three is usually the largest and most powerful wave in a trend, although some research suggests that in commodity markets, wave five is the largest. The news is now positive and fundamental analysts start to raise earnings estimates. Prices rise quickly, corrections are short-lived and shallow. Anyone looking to ‘get in on a pullback’ will likely miss the boat. As wave 3 starts, the news is probably still bearish, and most market players remain negative; but by wave 3’s midpoint, ‘the crowd’ will often join the new bullish trend. Wave 3 often extends wave 1 by a ratio of 1.618:1.
Wave 4: Wave four is typically clearly corrective. Prices may meander sideways for an extended period, and wave four typically retraces less than 38.2% of wave 3. Volume is well below than that of wave 3. This is a good place to buy a pull back if you understand the potential ahead for wave 5. Still, 4th waves are often frustrating because of their lack of progress in the larger trend.
Wave 5: Wave five is the final leg in the direction of the dominant trend. The news is almost universally positive and everyone is bullish. Unfortunately, this is when many average investors finally buy in, right before the top. Volume is often lower in wave 5 than in wave 3, and many momentum indicators start to show divergences, prices reach a new high but the indicators do not reach a new peak.
📙 The Ultimate Guide to Liquidity 🌊
📜 Chapters:
I - What is Liquidity & Why Does It Matter?
II - The Core Principal Of Liquidity
III - Liquidity & Human Emotions
IV - The Technicals Of Liquidity
🔥 V - Time, Price & Liquidity (The X & The Y Axis)
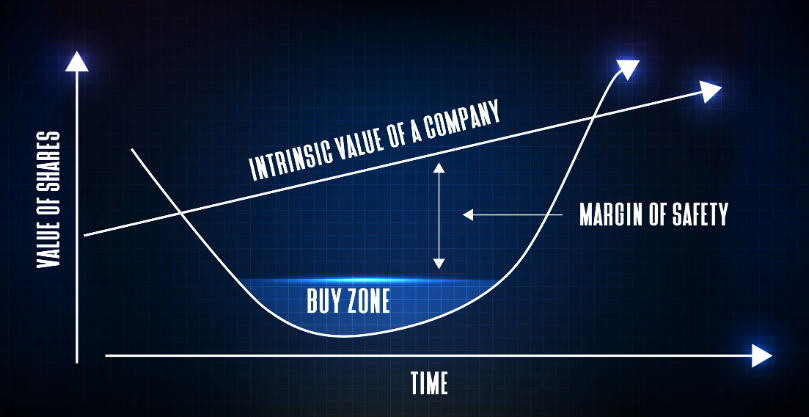
Margin of safety is one of the most important concepts for investors to understand 🏆🧵
The term was popularized by Ben Graham and is often used by top investors such as Pabrai and Buffett
Let's take a closer look at Margin Of Safety 🧵👇
=THREAD=
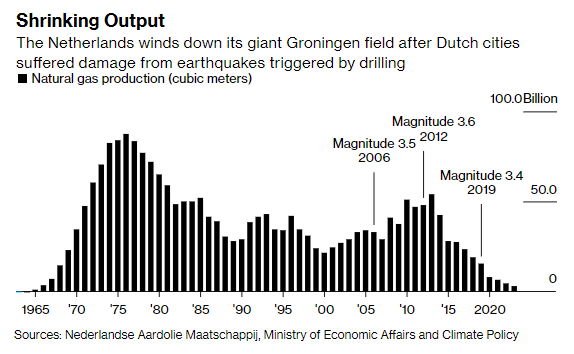
Es de sobra sabida la errática política energética de la Unión Europea 🇪🇺, y en abril tenemos una nueva muestra de ello.
Desde el día 1 de este mes, seis de los once puntos de extracción de gas que quedaban en el yacimiento de Groningen, en Países Bajos 🇳🇱, han dejado de operar.
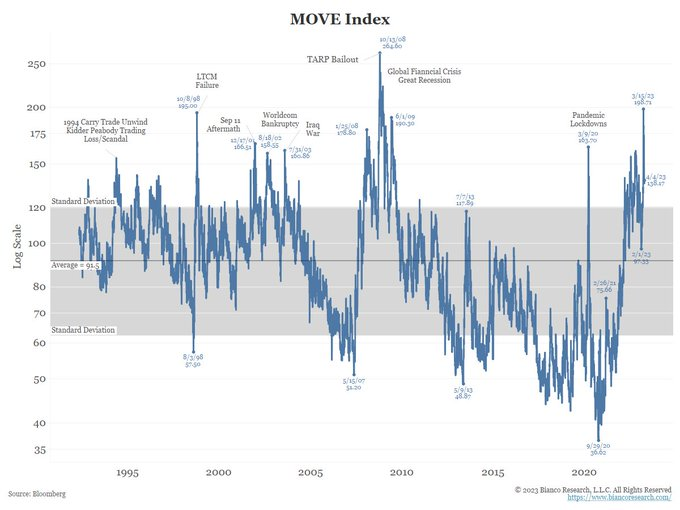
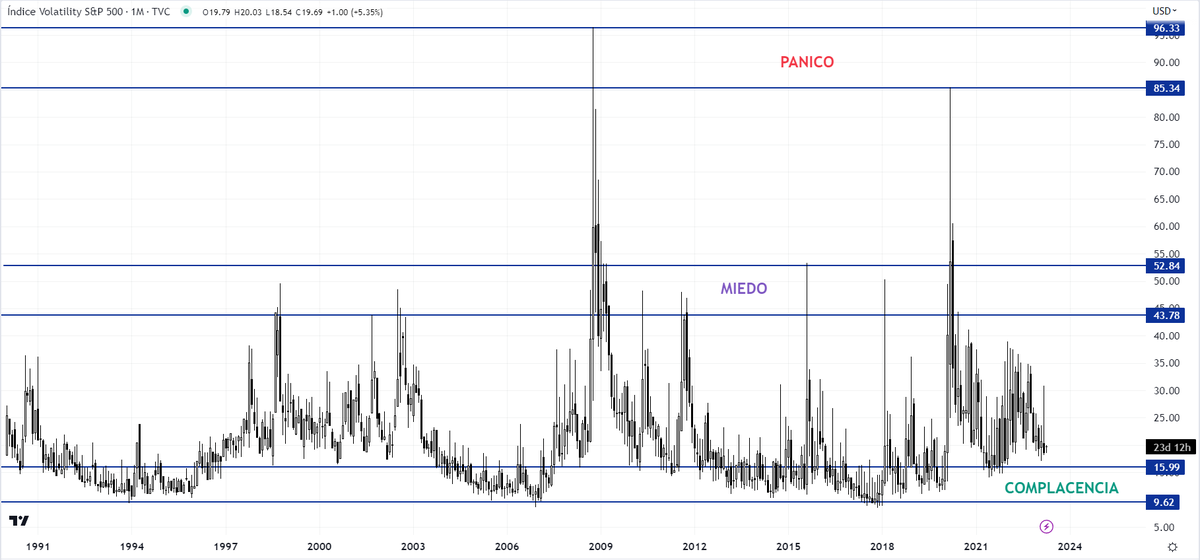
La volatilidad en el mercado de renta fija (MOVE Index) está en zona de máximos de las últimas 3 décadas, lo cual muestra la tremenda incertidumbre sobre las tres variables más importantes:
- evolución económica = ¿habrá o no recesión?,
- inflación = ¿Cuánto tardara en revertir al 2%?
- la crisis bancaria = ¿hemos visto ya lo peor o solo la punta del iceberg? .
En función de como se desarrollen esas magnitudes los bancos centrales tendrán que hacer equilibrios con su política monetaria.
Mientras tanto en la bolsa la volatilidad está muy cerca de zonas de complacencia. Cuando veo a los inversores de renta fija "atacados" y a los de renta variable "tan tranquilos" algo me hace sentir incómodo, alguno se equivoca.
Modern life has zapped your attention.
Cheap dopamine from Tik Tok, fast food, and video games is destroying our brains.
Here are 7 tips to build your attention span and regain your focus:
🇨🇳🇺🇲🏦 Guerra Fría Financiera: China vendiendo bonos del Tesoro de Estados Unidos. En el pico de 2013, China tenía $1,3 billones en bonos del Tesoro de EE.UU
Hoy tienen $850 mil millones y la venta se ha acelerado en los últimos 2 años.
🤯 Aprendizajes financieros super interesantes que hemos sacado estos días con la QUIEBRA de Credit Suisse y que están ocultos para el público no especializado.
Voy a tratar de explicártelos en detalle pese a que no es sencillo. Se viene HILO muy completo, sigue leyendo...
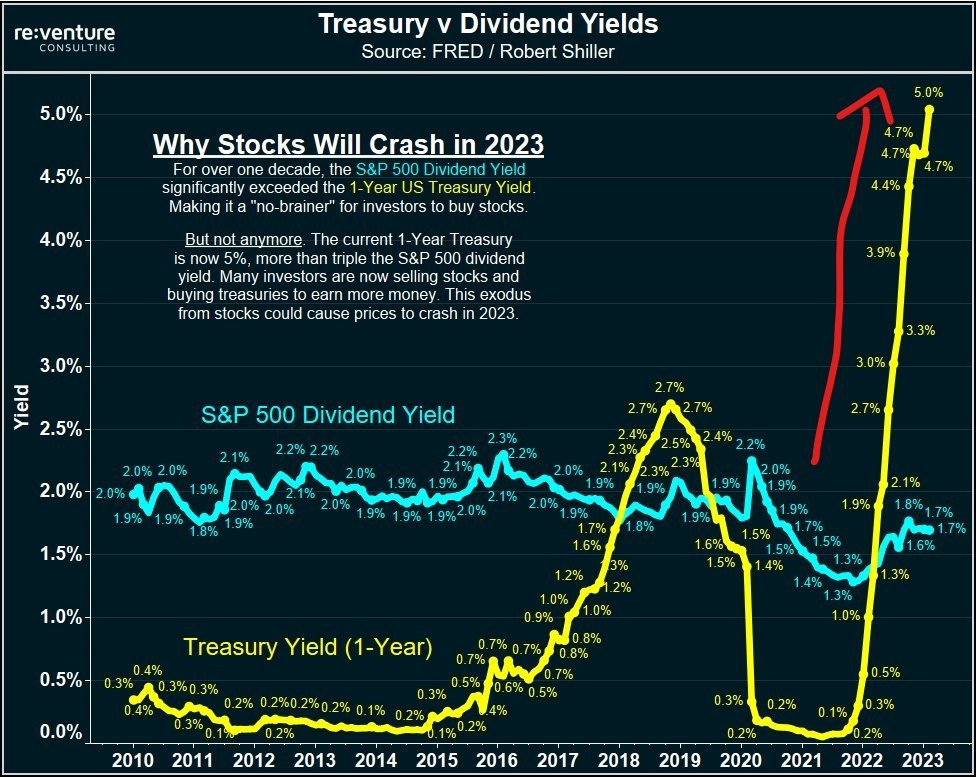
Uno de los argumentos más negativos para la bolsa es que la renta fija, que tiene menos riesgo que la renta variable, ofrece mejor rentabilidad que los dividendos que ofrece el S&P500.
40 Steps In The Traders Journey:
1. We accumulate information. We learn by buying books, asking questions, going to seminars and researching what really works in trading.
2.We begin to trade with our new-found knowledge.
3. We make profits only to give it back very quickly, realizing that we may need more knowledge or information.
4.We accumulate more information.
5.We switch the stocks we are currently following and trading.
6.We go back into the market and trade with our better system; this time it will work.
7. We lose even more money and begin to lose of confidence that we can be traders. The reality of losing money sets in.
8. We start to listen to other traders and what works for them.
9. We go back into the market and continue to lose more money.
10.We completely switch our style and method.
11.We search for more information.
12.We go back into the market and start to see a little progress.
13.We get over-confident in a single trade, and take on a big position thinking it is a sure thing.
14.We start to understand that trading successfully is going to take more time and more knowledge than we ever anticipated. Most people give up at this point.
15.We get serious and start concentrating on learning a real methodology.
16.We trade our methodology with some success, but realize that something is missing.
17.We begin to understand the need for having rules to apply our methodology.
18.We take a sabbatical from trading to develop and research our trading rules.
19.We start trading again with our rules, and although we find some success, we still hesitate when we execute.
20. We add, subtract, and modify rules to become more proficient in our trading.
21. We feel we are close to crossing the threshold of successful trading.
22.We start to take responsibility for our trading results, as we understand that our success is in us, not the methodology.
23.We continue to trade and become more proficient with our methodology and our rules.
24. As we trade, we have a tendency to violate our rules and our results are still erratic.
25. We know we are close.
26.We go back and research our rules.
27.We build the confidence in our rules, and go back into the market to trade.
28.Our trading results are getting better, but we are still hesitating in executing our rules.
29. We now see the importance of following our rules as we see the results when we don’t do so.
30. We begin to see that our lack of success is within us, and we begin to work on knowing ourselves better.
31.We continue to trade, and the market teaches us more and more about ourselves.
32.We master our methodology and our trading rules.
33.We begin to consistently make money.
34. We get a little over-confident and the market humbles us.
35.We continue to learn from our mistakes.
36.We learn smaller positions and dial down our emotions so we can trade smaller and be more disciplined.
37.We learn that risk management is one of the biggest keys to winning as a trader.
38.We stop thinking and allow our rules to trade for us, and our trading account continues to grow as we increase our position size as our account grows.
39.We are making more money than we ever dreamed possible.
40.We go on with our lives and accomplish many of the goals we had always dreamed of.