This month's https://t.co/tyokn7FEcR is up +3% from last June and -15% from May; it's very close to June 2024.
There are a lot of factors that could impact this throughout the month.
For more details, tune into the @dtcindex
Thanks to @TaylorHoliday@JeremiahPrummer@KnoCommerce@CommnThreadCo
@TaylorHoliday Definitely not.
Auto loan deliquency hit a high: https://t.co/uN3nWY86HA
That may have something to do with it.
(I'm trying to find a better source for the @dtcindex )
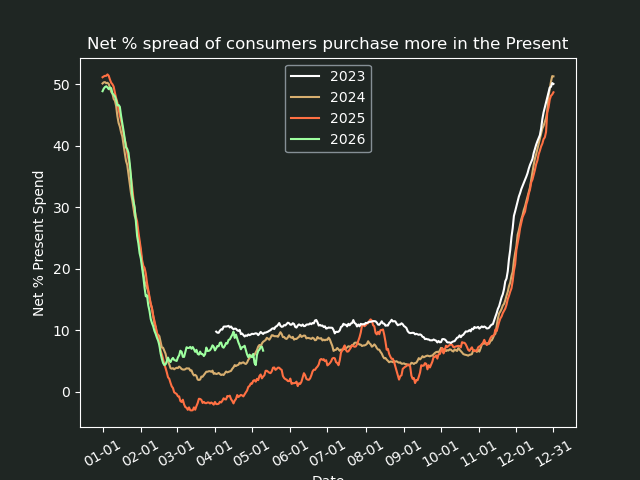
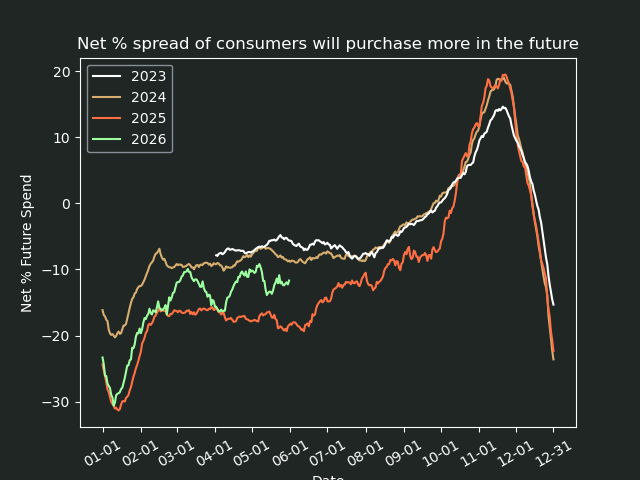
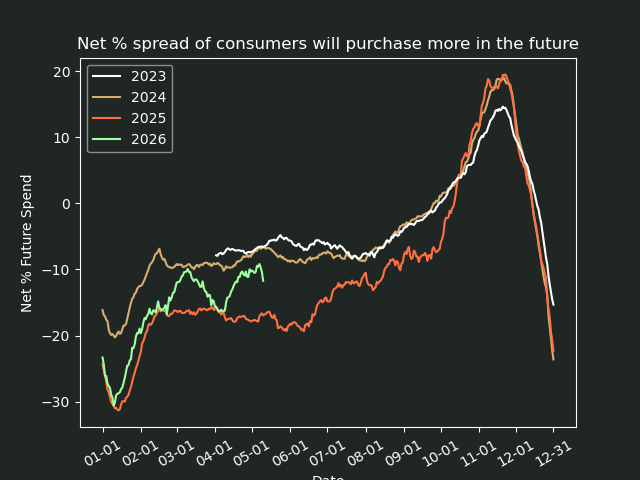
This is very interesting contrast in the https://t.co/tyokn7FEcR data:
Consumers say they love spending at nearly the highest level we've seen
At the same time, consumers are not planning to spend more than in 2023 (when spender sentiment was highest) or 2024 (still better than 2025 though)
Consumers want to spend, but they don't plan on it in the future.
Thanks to @JeremiahPrummer@TaylorHoliday@KnoCommerce@CommnThreadCo
More details in the @dtcindex
@oliviaakory@Zep_Haus@gregdale Thanks for sharing.
So, it sounds like the test doesn't include the effects of organic and affiliate content since those can't be excluded Geographically?
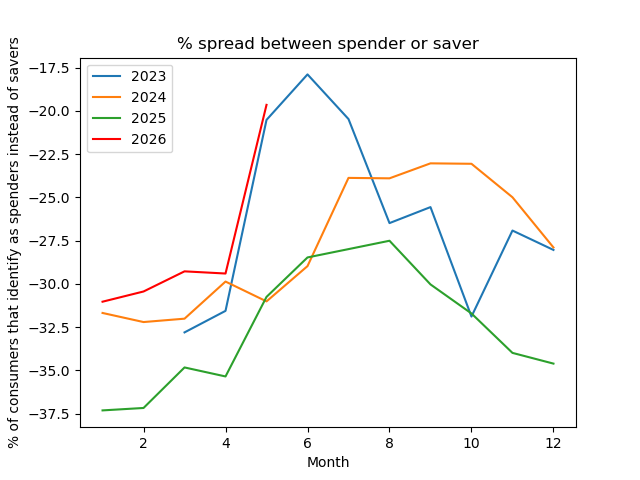
From this month's https://t.co/Kfhqb100RS data, we saw a large uptick in consumers saying they enjoyed spending more than saving their money at a higher rate than the last 3 years - it's much more similar to May 2023.
Thanks @TaylorHoliday@JeremiahPrummer@dtcindex
Revenue is up 14.5% year-over-year across our DTC Index dataset.
Brands increased ad spend by 18%. Acquisition efficiency only declined 2%. That gap is the story.
@RSteveData breaks down why spending power is surging, what Mother's Day data tells us about Memorial Day, and a statistical method for measuring whether Amazon is cannibalizing your DTC revenue or adding net-new sales.
https://t.co/l0r43oXZzZ
@UntAaron@CommnThreadCo True. That number is better considered on an individual brand basis, but it's healthy for those brands.
Returning Customer Revenue is up +13.40% YoY
And now they have more new customers to return.
Thank you for putting this report together and sharing. With any good research, I have more questions than comments:
The Report says that 25% of incremental revenue comes in the post-test is pretty consistent across channels. What is the distribution of tests among the ad channels considered here? (Is Radio 4%, CTC 18%, Podcasts 12%, etc.)
How was that post-treatment lift distributed time-wise? Did most of it happen in the first few days after the test ended with exponential decay or was it closer to linear decay? Or was this a function of how long the test ran?
Is there a correlation between Upper Funnel Metrics (Reach, Site Visits, Brand Search, etc.) to Lower Funnel Metrics (Orders, Revenue) in these tests? Can we statistically test these correlations? I'm looking for early signals of later success.
Is more of this latency captured around marketing moments? I especially think this applies to your outliers that are mentioned in the report.
Did the results vary by the size (revenue) of the brand?
Totally understand that releasing this information may not be in the best interest of Haus.
From this week's https://t.co/tyokn7FEcR data, Present Purchase Sentiment Increased and Future Purchase Sentiment took a dip.
Mother's Day took some of those planned Future purchases and pulled them into the present.
More charts in the @dtcindex
Thanks @JeremiahPrummer@KnoCommerce@TaylorHoliday@CommnThreadCo