How close did you follow the F1 this last season? 🏎️ In this #VOTD, @RafaCentenoP uses a waterfall chart and a heat map, among other chart types, to illustrate the points, positions, and performance per driver and circuit. https://t.co/DLRt2LljyJ
A few highlights from this week’s #DataFam Roundup:
🔹Reasons to enter #IronViz 2022
🔹Using @TableauPublic templates efficiently
🔹Upcoming @DLC Braindates
Get the rest on the blog! https://t.co/Srh0ygexqZ
My #TableauFF this week is @RafaCentenoP.
Rafael has a strong design style that gives each of his vizzes a personal touch. Check out his @tableaupublic portfolio for plenty of viz inspiration!
https://t.co/8kuo0yHV0T
🏀Best Performance of NCAA Men's Coaches, measuring Win Percentage vs Number of Seasons as a Coach.
🔗Link to interact in @tableaupublic: https://t.co/7nO0eqw0ZY
#B2VB#Tableau#datafam
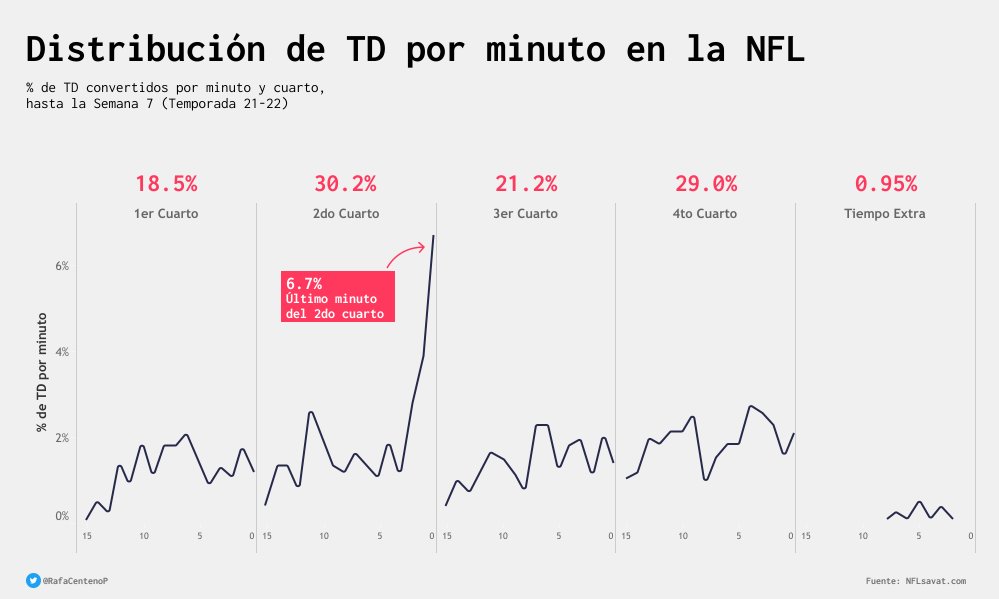
Distribución de TD por minuto en la NFL.
El 2do y 4to son los cuartos con mayor TD en un partido.
El ultimo minuto del 2do cuarto es donde se logran más TD en promedio.
Link para interactuar: https://t.co/UUmk0Pt5ob
#tableaupublic#figma#NFL#sportviz#SportVizSunday
Red Bull ha llegado a 200 pódiums en su historia. Vettel sigue siendo el piloto con mayor eficiencia en la escudería.
#tableaupublic#RedBull#figma#sportviz