🚨🚨SPY ALERT
NVDA DELIVERED. HERE ARE THE RECEIPTS.
Revenue: $96B vs $91.9B est. Beat by $4.1 billion.
Q3 Guide: $108B. First time NVDA has ever guided a full year ahead.
FY28: 70% growth. Supply constrained. Unconstrained demand: 100%+.
The number arrived. Now here is what happens to SPY tomorrow morning.
THE PUT DECAY:
13.7 million puts sit on the SPY surface. P/C OI ratio: 2.49. Two and a half puts for every call. Those puts were built over the last three weeks as the institutions hedged into NVDA. Tomorrow morning, the ones that are out of the money on a gap up begin dying.
Every put that loses value forces the dealer who sold it to buy back the shares they hedged with. 13.7 million contracts. The mechanical buying from the put decay is the fuel for the gap.
THE IV COMPRESSION:
Put IV closed at 19.4%. Call IV at 11.9%. The skew: +7.50%. The event premium is loaded entirely into puts. When the beat resolves and the uncertainty lifts, the put IV compresses from 19.4% back toward 12-13%. Every point of IV that comes out fires the vanna tailwind at -103K.
THE STRUCTURE ABOVE:
$1.31B of positive GEX sits between price and $786. The entire path from $766 to $800 is positive gamma.
$775: +$79M
$780: +$124M
$785: +$86M
$790: +$92M
$800: +$98M
The magnets are stacked and waiting. On a gap above $766.01, the flip breaks to the upside. The positive regime engages. The dealers start buying dips and selling rips. The shock absorber turns on. The magnets pull.
The cup and handle breakout at $779.37 triggers on a 1.7% gap. Target: $829.64.
The falling wedge target at $789 is 2.9% above. Day 35 of 41. Seven days remain.
THE ARC:
June 25: Falling wedge detected at $734.30.
July 10: Confirmed at $754.95. Target $789. Drawdown risk -5.7%. Published.
July 22: "We are heading to all time highs soon." SPY $747. Published.
July 27: G-D- regime study. 760 samples. 14 years. Published.
July 29: $728.69 low. Pre-FOMC. -$2.06B GEX. Five regime flips.
August 3: All-time high. $757.67.
August 4: QQQ momentum signal. ML reclassification to $791. "Pre-NVDA selloff is your next 3% opportunity." Published.
August 12: $776.85 broke. Bull flag and cup and handle triggered simultaneously.
August 13: $779.30 ATH. GEX +$2.91B. Series record.
August 17-21: Pre-NVDA volatility. Overnight repairs. Skew inversions. $765 gamma cliff. Decay education.
August 26: NVDA beat by $4.1B. Q3 guide $108B. FY28 70% growth.
Sixty-two days. Forty-four posts. Every level tracked. Every framework published. Every receipt timestamped.
The falling wedge said $789. The cup and handle says $829. The data said buy the pre-NVDA dip. NVDA delivered.
Tomorrow morning: 13.7M puts decay. $1.31B of magnets pull. The flip breaks. The patterns trigger. The series resolves.
We published the target. We published the drawdown. We published the volatility window. We published the catalyst. The number confirmed.
That is what sixty-two days of data looks like when it works.
You don't have to thank us. Rain, sleet or snow Alphatica is ready to go.
$SPY $QQQ $NVDA
Nine times in twenty-six years, NVIDIA went into its August print soft. Five of those returned between +14% and +22% over the next twenty sessions, two returned between −23% and −27%, and almost nothing landed in between. https://t.co/U0J8xWLok9
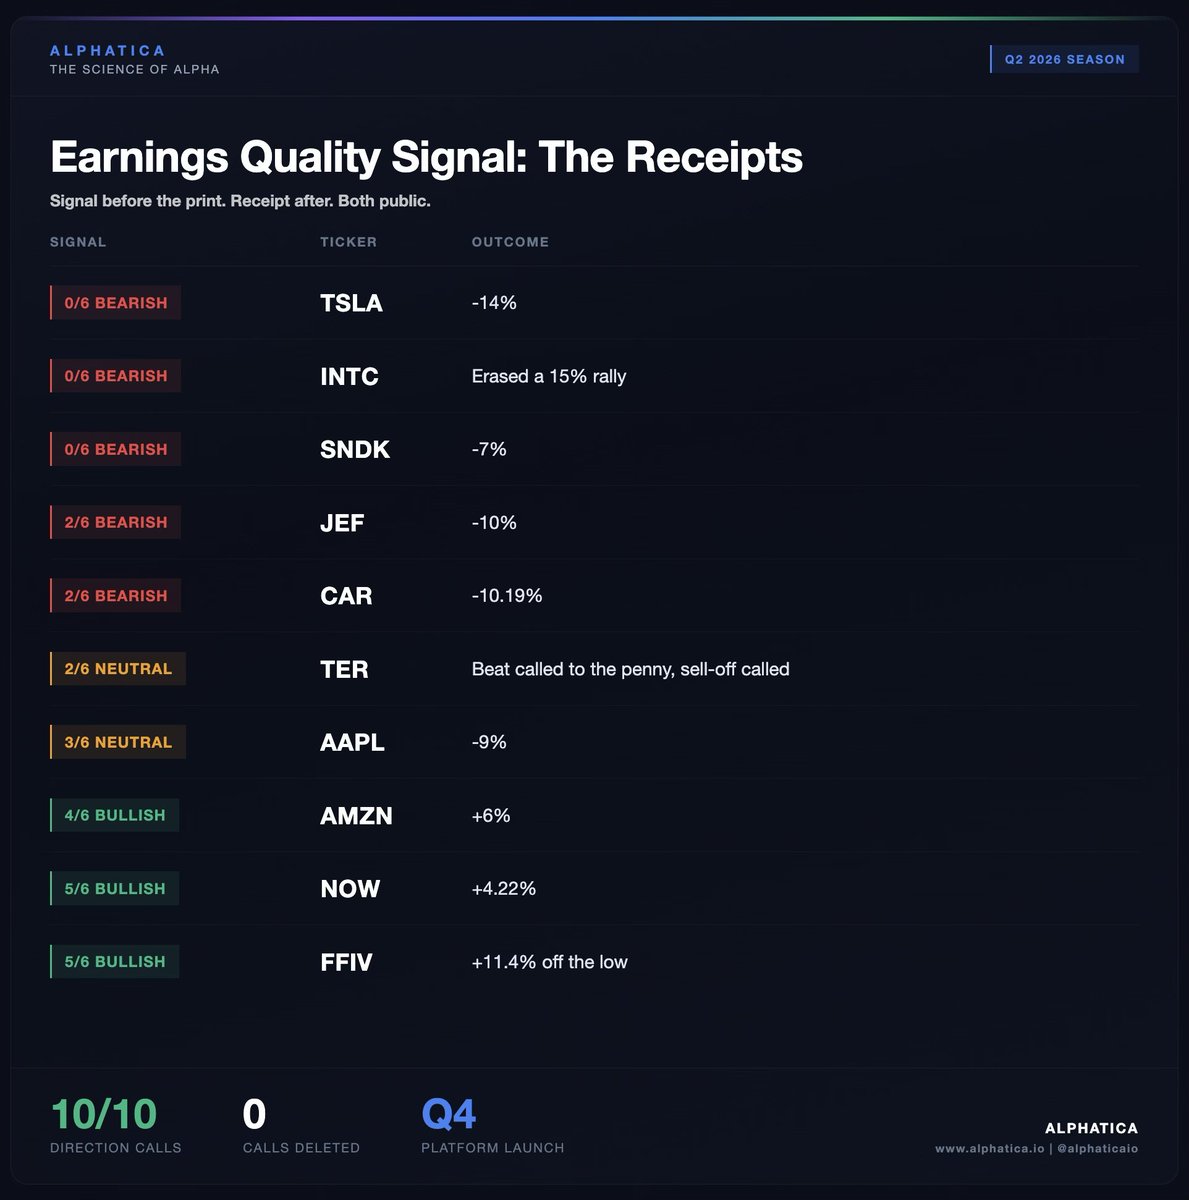
Every call goes up before the print. Every receipt goes up after.
Q2 2026, Alphatica Earnings Quality Signal:
0/6 BEARISH TSLA -14%
0/6 BEARISH INTC erased a 15% rally
0/6 BEARISH SNDK -7%
2/6 BEARISH JEF -10%
2/6 BEARISH CAR -10.19%
2/6 NEUTRAL TER beat called to the penny, sell-off called
3/6 NEUTRAL AAPL -9%
4/6 BULLISH AMZN +6%
5/6 BULLISH NOW +4.22%
5/6 BULLISH FFIV +11.4% off the low
Next up is NVDA, August 26 post-market. The call posts before it.
What else runs here: Institutional quality research that you will only find behind trading desks and prime brokerages.
The edge was never the data. It was who could afford the analysis. Q4 changes that.
Institutional and data licensing: [email protected]
Get on the list first: https://t.co/5wz4VrHpgG
$NVDA $SPY $QQQ
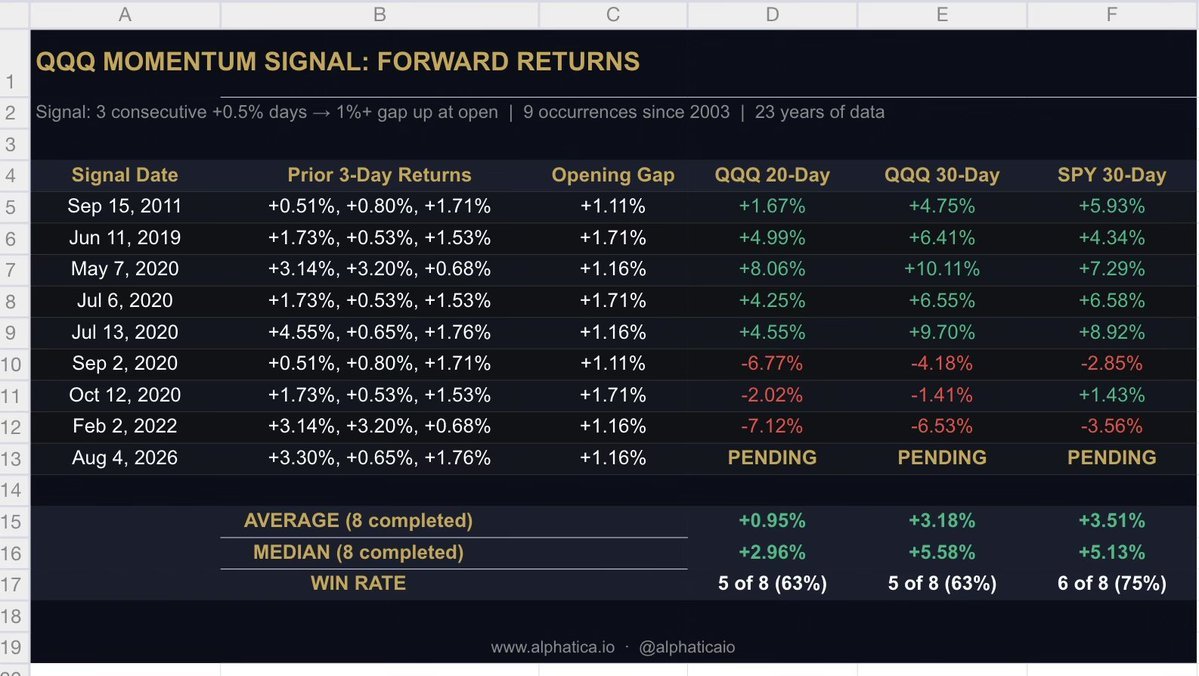
A rare signal we flagged on August 4 is live.
It has fired only 9 times in 23 years.
The setup: QQQ printed three consecutive +0.5% sessions, then opened with a 1%+ gap.
Historical base rates from the prior 8 occurrences:
SPY 30-day: +3.51% average | +5.13% median | 75% win rate
QQQ 30-day: +3.18% average | +5.58% median
Day 4 tracking:
SPY +0.22%
QQQ −0.41%
Flat and consolidating at all-time highs.
This is normal. Six of the eight prior signals also consolidated in the first week before the move developed. The median returns have historically been back-loaded, not front-loaded.
The 30-day window runs into early September.
NVDA reports August 26 (Day 16 of the signal). The catalyst and the window converge.
The signal remains active. The clock is running.
$SPY $QQQ $NVDA
🚨We want to get this out to our feed and followers before the fear post hits from Fintwit.
A doji just printed on SPY at all-time highs. FinTwit will tell you this is a reversal signal. We tested it.
228 SPY doji days. 2,074 non-doji days. 2017 to 2026. Identical forward-return methodology at every horizon. Here is what the data says.
DOJI vs BASELINE:
Horizon Doji Baseline Difference p-value
5-day +0.36% +0.31% +0.05% 0.71
10-day +0.55% +0.61% -0.06% 0.76
20-day +1.04% +1.14% -0.11% 0.73
60-day +3.53% +3.01% +0.52% 0.23
Zero significance at every horizon. Not one p-value below 0.23. The conventional threshold is 0.05.
The differences are basis points. The signs flip-flop. A doji day forecasts SPY's next 5 to 60 days no better than picking a random Tuesday.
THE 90% TRAP:
Someone will post that dojis have a 90% success rate. They do. 89.9% of doji days saw SPY print a 2% gain within 60 days. Sounds impressive until you check the baseline: 89.1% of all non-doji days did the same thing. SPY prints a 2% gain within 60 days from almost any starting day in a bull market. The doji added nothing. The success rate is a base-rate mirage.
WHAT THE DOJI ACTUALLY TELLS YOU:
It is descriptive, not predictive. It tells you where the fight is, not who wins. Today the fight is at $773 with a +$540M gamma magnet at $775 and the composite at neutral. The candle describes the indecision. The gamma structure, the premium flow, and the institutional positioning tell you which way it resolves.
We test everything. When the data says a pattern works, we publish it with the p-value. When it doesn't, we publish that too. The doji doesn't work on SPY. Now you know.
$SPY $QQQ $IWM
Another Fintwit debate. Let's settle it with data.
"VIX is green while SPX is at all-time highs. That's bearish."
You've seen this take posted many times over the last 24 hours. We tested it.
20 years of data. 1,289 ATH days across SPY and QQQ. CBOE spot VIX. Welch's t-tests, bootstrap CIs, permutation tests, Benjamini-Hochberg FDR correction, Newey-West HAC for overlapping windows.
The result: 0 out of 20 statistical tests reached significance after FDR correction.
ATH + VIX green forward returns:
SPY 20-day: +0.28%
QQQ 20-day: +0.61%
Both positive. Both with 62%+ win rates. VIX closing green on an ATH day does not predict a reversal.
ATH days that were followed by another ATH within 20 days: 92%.
The market does not top out because VIX twitched green on a record close. ATHs cluster. Momentum is real. VIX color on the day is noise.
One conditional finding worth noting: when VIX is already above 15 and closes green on an ATH day, the forward returns are weaker. The interaction term reaches significance in the pooled model. The direction replicates across both SPY and QQQ at every horizon tested.
But the effect is small, the subset sample is limited, and it is nowhere near a tradeable signal.
The blanket claim is dead. The nuance exists but doesn't save the narrative.
Data does not care about your priors.
If this research is useful to you, a repost helps it reach the traders and investors who could benefit from it. We publish this work to be shared.
$SPY $QQQ $IWM
@alphaticaio Scaled out of my SPX put spreads from 7/10 - 50% out at 30% profit and holding the rest based on the falling wedge confirmation signal provided that day - held through the drawdown.
SPY has 26 all-time highs in 144 trading days. A new high every 6 sessions.
"Nowhere to go but down."
We tested 22 years of SPY and QQQ data. Every ATH since 2003.
After hitting an all-time high, the market makes another new high within 60 days 98% of the time. Within a year: 92%.
"Nowhere to go but down" is wrong 92-98% of the time.
But every top starts at an ATH. True. All 24 major drawdowns began from one. But there were 1,136 total ATH days. Only 2.1% are THE top. The other 97.9% are just another day on the way higher.
All-time highs aren't the end of the rally. The market tops when ATHs stop. Not when they start.
$SPY $QQQ