GOLD VS MONEY SUPPLY: WHERE IS THE TRUTH?
As publications comparing gold with money supply flourished over the past 24h, comparing the 2 curves, with gold appearing late relative to M2, let's see where the metal really stands relative to money supply.
Indeed, based on the chosen start date, the same chart could have told different stories.
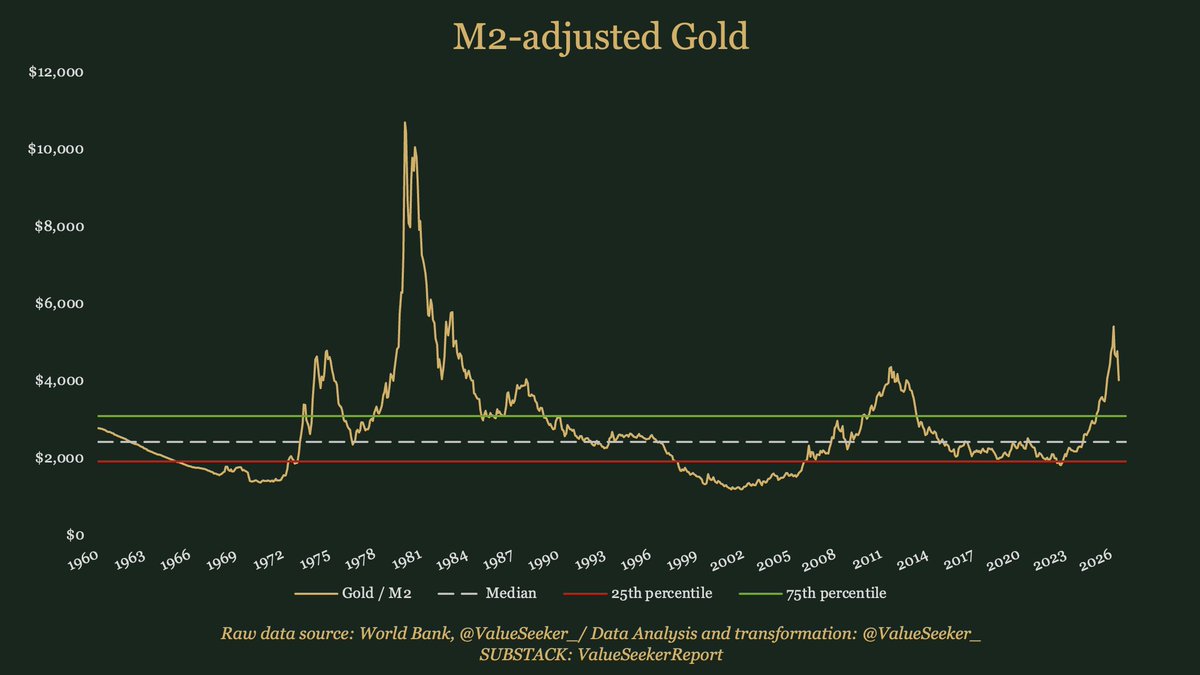
Adjusting gold for money supply growth, one can see below where does gold currently stand relative to previous highs, now equivalent to:
• $4'800 (1974)
• $10'000 (1980)
• $4'500 (2011)
With a recent peak above $5'000, gold has therefore beaten its 1974 & 2011 tops, while remaining halfway from its all-time high.
So, "late" may not be the right qualifier as gold has risen faster than M2 since 2022.
Indeed, still adjusted for M2, the metal has climbed to its 96th percentile during its recent peak, and remains now in its 89th percentile.
In other words, gold has only been more expensive 11% of the time.
While it could still climb (most likely if the US Dollar where to fall and US inflation to climb), and has its place in everyone's long-term portfolio, those looking for bargains among hard assets may want to expand their investment horizons as all other hard commodities currently trade at a discount relative to gold, and at a lower percentile once adjusted for money supply.
Hard assets, adjusted for money supply, measured in percentile (the lower the percentile, the cheaper the asset):
• Iron ore - 1st
• Lead - 2nd
• Nickel - 2nd
• US Nat Gas - 5th
• Platinum - 11th
• Aluminum - 13th
• Zinc - 13th
• Brent Crude oil - 15th
• Coal - 18th
• Copper - 34th
• Tin - 52nd
• Silver - 59th
• Gold - 89th
Here is why, while I was overweight precious metals last year, I am now favoring energy and industrial metals, purely due to their catch-up potential relative to both gold and money supply.
No sentiment involved, just an opportunistic approach to investing.
---
Calculations are my own.
It is important to note that the bout of volatility so far this year in key market prices extends beyond oil.
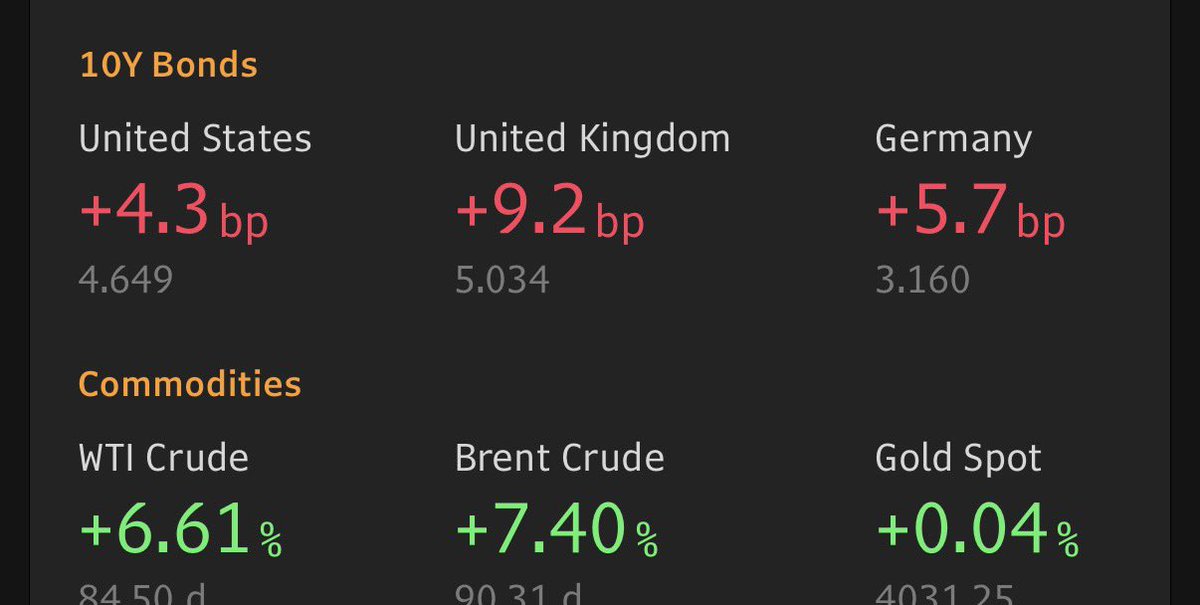
We are also seeing big moves in government bond yields, which serve nationally—and in some cases, internationally—as benchmarks for corporate borrowing, home mortgages, and more.
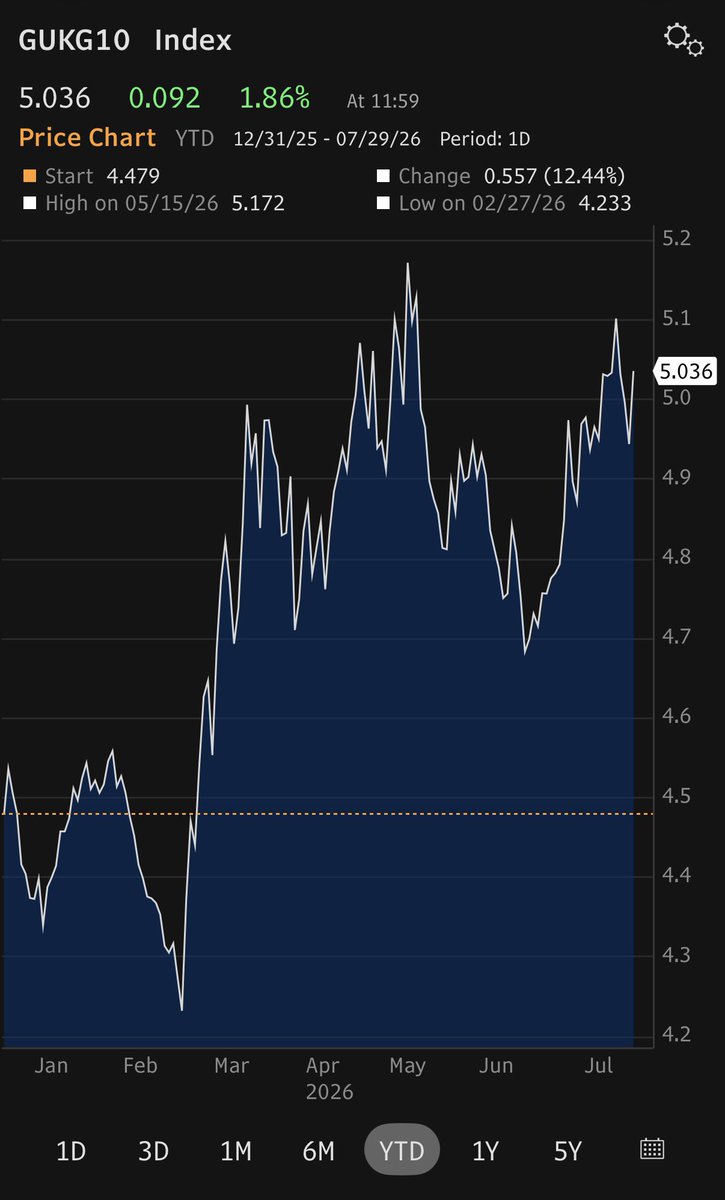
As illustrated below, this is particularly the case for "high-beta" economies such as the UK. Indeed, this year alone, Britain's 10-year bond yield has been as low as 4.23% and as high as 5.17%, with substantial volatility in between (see Bloomberg data below).
#economy #markets #bonds #oil
Ranked: AI Competitiveness by Country 🤖
This graphic by Iswardi Ishak is one of the many incredible data-driven charts and stories from creators featured on our @VoronoiApp. ✅
https://t.co/u0yghxsSZx
🛢️ Oil’s biggest producers are under pressure
OPEC+ just chose to stand still💥
Today’s OPEC+ meeting landed exactly where the market expected.
No policy change. No extra barrels. No new cuts.
That decision matters more when you look at who actually produces the oil, as shown in the chart.
3 countries alone account for 40% of global crude supply
🇺🇸 United States
🇷🇺 Russia
🇸🇦 Saudi Arabia
And 2 of them sit at the center of today’s geopolitical stress.
What OPEC+ decided today
• Production quotas unchanged through Q1
• Previously planned output increases remain paused
• The message: fundamentals first, politics second
With prices still soft and inventories high, the group chose discipline over reaction.
Several key producers are facing instability at the same time:
• Saudi Arabia
Internal cohesion holds, but Riyadh is navigating rising regional tension around Yemen while still acting as OPEC+’s main stabiliser.
• #Russia
Ukrainian drone strikes continue to hit refineries and export infrastructure. Flows are being rerouted, not stopped, but the margin for error is shrinking.
• Iran
Domestic unrest is rising, yet exports remain high under weak enforcement. Either escalation or a harder sanctions stance could swing supply quickly.
• #Venezuela
Following Maduro’s removal, exports are disrupted short-term but could become a medium-term supply wildcard if production is revived under a new political framework.
What the market is saying
Despite all this, oil prices barely moved.
Why?
Because the market is still focused on:
• Oversupply risk
• Weak demand expectations
• Non-OPEC production growth
Geopolitics is adding volatility, not tightening the balance.
Oil prices are not driven by how much oil exists underground.
They are driven by which producers can deliver barrels consistently at the margin.
Today, #OPEC+ is betting that instability will stay contained and that fundamentals will dominate through early 2026.
If one of these flashpoints turns from noise into real supply loss, this calm won’t last.
Which country do you think is the biggest hidden risk for global oil supply right now?
(do not forget to subscribe to my newsletter, link in my bio)
#oott
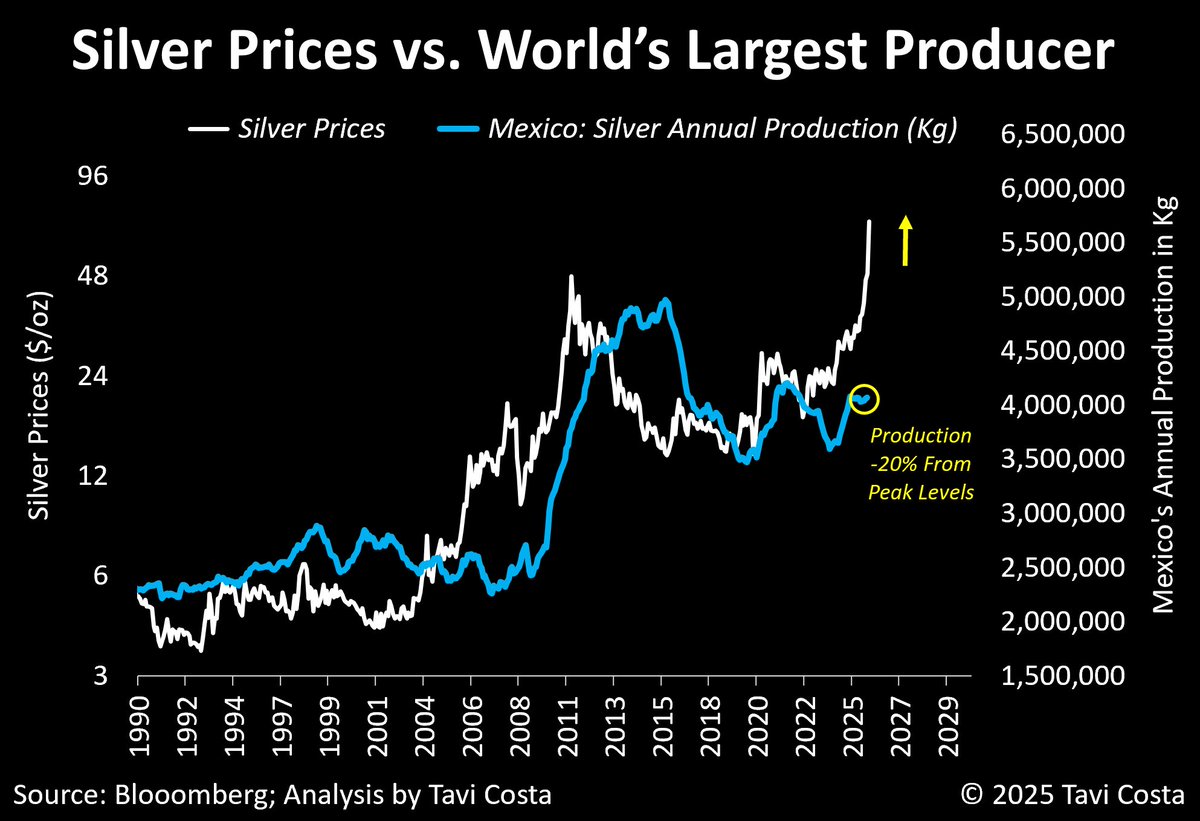
Silver surging again while the consensus remain convinced that mean reversion is inevitable.
I strongly disagree.
Buckle up — this move is far from finished, in my view.
🇻🇪 Venezuela holds 161 metric tons of gold reserves, making it the Latin American country with the largest holdings.
At today's prices it is worth about $22B.
Oil + Gold = Jackpot 🇺🇸
Copper supply problems keep piling up
- 1990-2023: 239 major copper discoveries
- 148 are not yet in production
- 121 haven’t completed feasibility studies
- Just 15 have begun development
Here’s the problem:
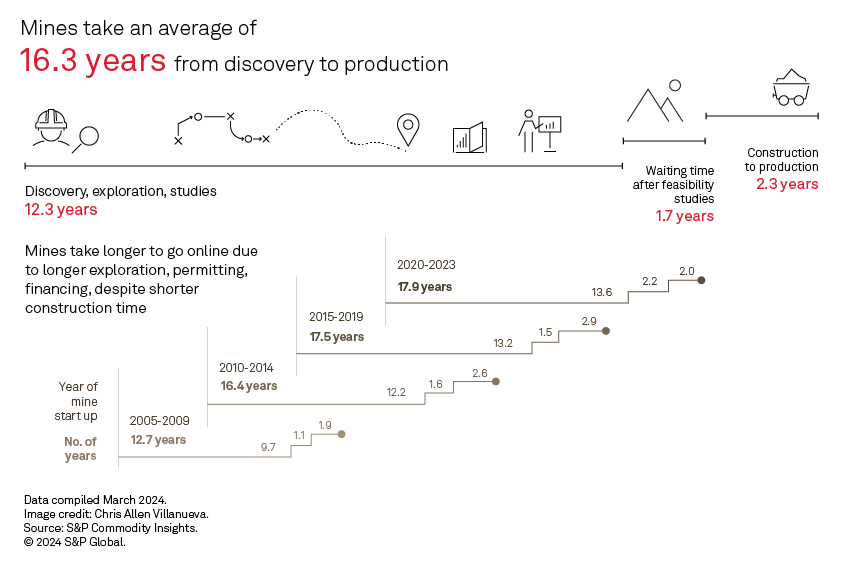
Lead times to develop these mines have surged ~40%, to roughly 18 years.
Around 90% of major discoveries that haven’t completed feasibility studies still need ~10 years to reach first production.
Over the long term copper is one of the clearest bets in the commodity universe
Retail Investor portfolio allocations to Commodities remain historically low...
Especially commodities ex-precious metals (still at a record low).
Early. 📈
Interesting dynamic in Commodities.
While the index is breaking out, individual commodities are still doing their own thing -- which indicates that speculative money has not yet piled into commodities...
(we're still early on this one)