⚙ Quantitative models for leading U.S. & global macro indicators ⚠ U.S. Recession probability models ⏱ S&P 500 market timing 🌐 Geopolitical risk analysis
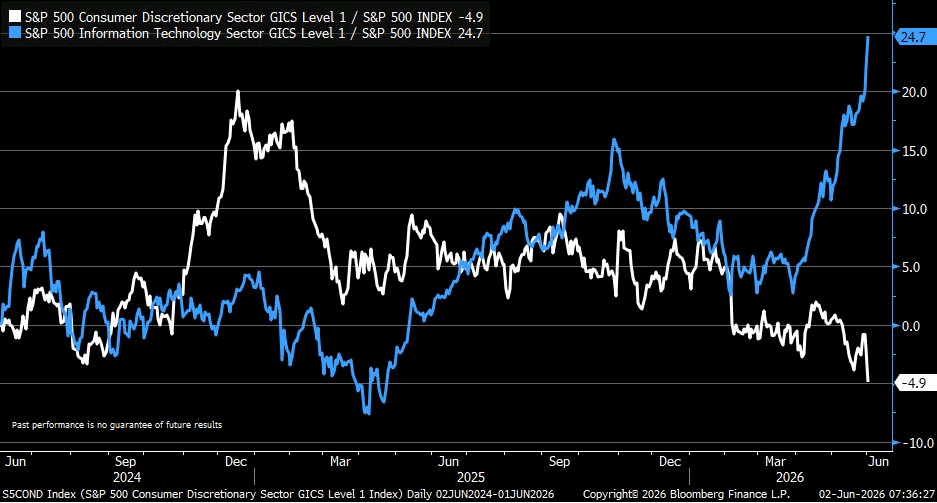
Two ratios, one circuit. The capex dollars lifting Tech to a 2-year relative high of +24.7 and the household dollars draining out of Consumer Discretionary to a 2-year relative low of −4.9 are not separate stories — they are the same dollar moving through different doors, and the entire thirty-point spread opened in roughly ten weeks of near-vertical move since late March. Textbook rotation has early-cycle Discretionary leading late-cycle Tech; that order is running backwards, which tells you this is not a cycle at all but a single capex vertical printing on the tape. Hyperscaler AI spend, ad budgets, cloud seats, software renewals — every line item funding that spread is sourced, eventually, from the household wallet now rationing under delinquency stress, softer real wages and a cooling jobs market. Tech’s earnings engine is partly powered by the very consumer it is outrunning. The vertical line eventually has to pay rent. https://t.co/9ePJiNYuJs
Every major market top rang the same chord: extreme valuation, narrow leadership, complacent positioning, decaying internals, loosening credit — all at once. No single bell times a top. The chord does — and that cluster has preceded every one.
Mid-2026 is the densest such reading since 1999: Shiller CAPE near its 1999 record, the equity risk premium back at zero, fund-manager cash on a sell signal, a quarter of the index already in private bear markets behind the highs.
This isn't a timing signal. It's a weather forecast.
So batten the hatches and reef the sails — but hold your course. Markets stay irrational far longer than bears stay solvent.
Because you don't turn the boat on a falling barometer — you ready the ship while the sea is still calm enough to work the lines as we describe at https://t.co/Xaux0C5H9X
Three consecutive weekly draws of -8.6M, -9.92M, and -7.99M barrels have rewritten the EIA record book — each individually eclipsing the previous all-time high of 8.4M bbl set during the September 2022 Russia-Ukraine response. The Strategic Petroleum Reserve sits at 357M bbl, seven million above the 2023 trough that defines this chart's five-year floor; at the current ~8.8M/week pace, next Wednesday's print breaches it, and the August trajectory lands near 250M — the lowest level since the 1980s. Yet the structure inverts the read: this is not a sale. The 2026 SPR Exchange Program, the Trump administration's response to the US-Iran conflict, loans crude to refiners now against in-kind repayment in 2026-2029 at a 1.20-1.25x premium — roughly 34-43M extra barrels owed back against the 172M committed through August, running at ~30x the routine NDAA pace. The 2000 hurricane and 2011 Libya exchanges, each ~30M bbl, repaid cleanly into flat-to-declining crude; at 172M this commitment is six times either precedent, into a live supply shock with no resolution priced. The asymmetry is the trade: three years of patient refill erased in six weeks, with the cushion spent mid-conflict and relief at the pump borrowed against a forward curve the Treasury does not control.
Every major market top rang the same chord: extreme valuation, narrow leadership, complacent positioning, decaying internals, loosening credit — all at once. No single bell times a top. The chord does — and that cluster has preceded every one.
Mid-2026 is the densest such reading since 1999: Shiller CAPE near its 1999 record, the equity risk premium back at zero, fund-manager cash on a sell signal, a quarter of the index already in private bear markets behind the highs.
This isn't a timing signal. It's a weather forecast.
So batten the hatches and reef the sails — but hold your course. Markets stay irrational far longer than bears stay solvent.
Because you don't turn the boat on a falling barometer — you ready the ship while the sea is still calm enough to work the lines as we describe at https://t.co/Xaux0C5H9X
@gnoble79 This is a barometer reading, not a clock. Markets can stay irrational far longer than the cautious can stay solvent. So do not turn the boat. Reef the sails. https://t.co/UveIh04nh8
Every prior time one industry pushed to extreme weight in the S&P 500, the index topped with it. Media & Entertainment hit ~24% in March 2000 — the bell at the dot-com peak. Financial Services reached ~22% in October 2007 — weeks from the cycle high. Energy crested ~16% in mid-2008, before the GFC second leg. Three for three. Chips at ~17% in May 2026 is the fourth setup, and the trajectory — five percent to seventeen in three years — traces Media’s 1998-2000 vertical arc. The slope is the diagnostic, and the composition is sharper still: prior peaks spread across dozens of constituents, today’s ~17% is single-name-heavy, NVDA alone near 7% of the S&P. Vertical expansions are built by concentrated mark-to-market in a handful of leaders absorbing the marginal passive bid; the curve goes parabolic, the unwind mechanical. Every passive dollar — roughly $10T of household savings embedded in pensions, 401(k)s, target-date funds — now carries that chip beta whether the holder consented or not. The pattern is not a forecast. It is a precedent waiting on its catalyst. https://t.co/9ePJiNYuJs
Valuations have been thrown out the window. Three for three at -22% in 2000, 2007, 2022 — each a coincident peak, the 1st two followed by 45-55% drops, the 3rd by a credible 25% down payment before the market did what the prior episodes never did. It recovered, and kept going. The forecast did not relent. It deepened from roughly -30% in 2022 to -50.8% today, while the index it indicts climbed another third higher. The mechanism is arithmetic: a ten-year forecast made eight years ago minus what the S&P actually delivered since. Every dollar of rally above expectation deepens the implied giveback. The lower panel is the chart's confession: R² has not decayed, it has stepped down from 0.80 toward 0.35 in discrete drops — the fingerprint of regime breaks, not aging math. Trillions of Fed balance-sheet expansion, mega-cap earnings concentration hollowing the aggregate P/E, passive flows displacing the valuation-sensitive marginal buyer, the central-bank put priced rather than contingent: the math is intact, the market it was fit on is not. A manifestly bearish chart whose own R² counsels against acting on its depth — use it for what it now is, a tape-condition gauge, not a top-caller. Adjudication prints May 2028.
Valuations have been thrown out the window. Three for three at -22% in 2000, 2007, 2022 — each a coincident peak, the 1st two followed by 45-55% drops, the 3rd by a credible 25% down payment before the market did what the prior episodes never did. It recovered, and kept going. The forecast did not relent. It deepened from roughly -30% in 2022 to -50.8% today, while the index it indicts climbed another third higher. The mechanism is arithmetic: a ten-year forecast made eight years ago minus what the S&P actually delivered since. Every dollar of rally above expectation deepens the implied giveback. The lower panel is the chart's confession: R² has not decayed, it has stepped down from 0.80 toward 0.35 in discrete drops — the fingerprint of regime breaks, not aging math. Trillions of Fed balance-sheet expansion, mega-cap earnings concentration hollowing the aggregate P/E, passive flows displacing the valuation-sensitive marginal buyer, the central-bank put priced rather than contingent: the math is intact, the market it was fit on is not. A manifestly bearish chart whose own R² counsels against acting on its depth — use it for what it now is, a tape-condition gauge, not a top-caller. Adjudication prints May 2028.
The exhaustion isn't a side effect — it's the cover. Tape chases every memorandum-of-points while throughput sits at 5.7 ships/day, refining cracks widen, and Asian buyers scramble for non-Gulf barrels. Memorial Day's $7 drop on holiday liquidity, then Asia bidding back $2-3 on the Iranian vessel attacks and SAM hit near Larak — bifurcation in plain sight. Macro tourists trade tweets; physical players hedge landed costs. The move comes violently, from something concrete, after everyone has stopped watching.
Valuations have been thrown out the window. Three for three at -22% in 2000, 2007, 2022 — each a coincident peak, the 1st two followed by 45-55% drops, the 3rd by a credible 25% down payment before the market did what the prior episodes never did. It recovered, and kept going. The forecast did not relent. It deepened from roughly -30% in 2022 to -50.8% today, while the index it indicts climbed another third higher. The mechanism is arithmetic: a ten-year forecast made eight years ago minus what the S&P actually delivered since. Every dollar of rally above expectation deepens the implied giveback. The lower panel is the chart's confession: R² has not decayed, it has stepped down from 0.80 toward 0.35 in discrete drops — the fingerprint of regime breaks, not aging math. Trillions of Fed balance-sheet expansion, mega-cap earnings concentration hollowing the aggregate P/E, passive flows displacing the valuation-sensitive marginal buyer, the central-bank put priced rather than contingent: the math is intact, the market it was fit on is not. A manifestly bearish chart whose own R² counsels against acting on its depth — use it for what it now is, a tape-condition gauge, not a top-caller. Adjudication prints May 2028.
An oil shock fires a familiar reflex — US pump prices, a hotter CPI print, a Fed boxed in. That reflex points at the wrong victim. Strip ~13 MM Bbl/d from global supply at peak — roughly 13% of the world’s ~100 MM Bbl/d, two-to-three times the 1973, 1979, and 1990 shocks — and the damage isn’t a US story; it’s a synchronized stagflationary tax on everyone who imports crude. The US, now roughly oil-neutral, sits closest to the exit: higher prices that bleed consumers also flood domestic producers with revenue, leaving the net hit near zero. The real casualties are Europe, Japan, and above all China and India — growth-sensitive economies structurally short barrels, with no shale cushion to self-insure. Bypass pipelines cap the forfeit at 13 rather than 20, but they run flat-out from day one, a fixed floor with no give. And the cumulative red line — ~2 billion barrels, roughly 20 days of world demand gone — keeps climbing a full quarter after July’s reopening. The shock is global; the safe harbor flies a US flag.
An oil shock fires a familiar reflex — US pump prices, a hotter CPI print, a Fed boxed in. That reflex points at the wrong victim. Strip ~13 MM Bbl/d from global supply at peak — roughly 13% of the world’s ~100 MM Bbl/d, two-to-three times the 1973, 1979, and 1990 shocks — and the damage isn’t a US story; it’s a synchronized stagflationary tax on everyone who imports crude. The US, now roughly oil-neutral, sits closest to the exit: higher prices that bleed consumers also flood domestic producers with revenue, leaving the net hit near zero. The real casualties are Europe, Japan, and above all China and India — growth-sensitive economies structurally short barrels, with no shale cushion to self-insure. Bypass pipelines cap the forfeit at 13 rather than 20, but they run flat-out from day one, a fixed floor with no give. And the cumulative red line — ~2 billion barrels, roughly 20 days of world demand gone — keeps climbing a full quarter after July’s reopening. The shock is global; the safe harbor flies a US flag.
Our new base case is that the world will forfeit 2BN barrels of production...even if the Strait begins to open in July. The problem??? The world cannot lose 2BN barrels of production...the system will break well before then.
S&P 500 prints new ATH while 23% of components in bear markets — a textbook narrowing tape. Consumer Discretionary leads the damage at 46%, consistent with the K-shaped consumer stress visible elsewhere; Healthcare (37%), Staples (32%) and Materials (32%) round out the carnage. Even Technology deteriorated from 14% to 21% over the past two weeks despite the AI bid. Only Energy (4%), Financial (8%) and Real Estate (10%) remain structurally healthy. When breadth fails to confirm new highs and defensive sectors break first, that is not what traditional late-cycle bull markets look like.
Taken from Chart-of-the-day at https://t.co/tnE4VXqfe8