To mark the official launch of E-nano Equity Index futures, our Equity team hit Times Square to celebrate in front of the @Nasdaq Tower.
Built for precise benchmark exposure, E-nano Equity Index futures are our most accessible contracts yet.
THIS HAS MARKED EVERY MAJOR BUYING & SELLING OPPORTUNITY SINCE 1990
Dot-Com Crash.
Global Financial Crisis.
COVID Crash.
2022 Bear Market.
2025 Tariff Selloff.
The $VIX is Wall Street’s fear gauge.
If you trade $SPY or $QQQ, you need to understand it.
VIX below 20: TRIM / REDUCE RISK
VIX 20–30: HOLD
VIX 30–40: START BUYING
VIX above 40: BUY THE PANIC
RIGHT NOW: VIX 14.25
We’re in the low-volatility zone.
Let winners run, but don’t chase. Trim extended positions and keep cash ready for the next volatility spike.
Buy when others are fearful. Sell when they are greedy.
🚨 The City of London Is Preparing for the Biggest Financial Bloodbath in Decades
Central banks (BIS, BoE, IMF) are warning: Trillions in debt-fueled AI hype will pop like dot-com, risking global crash.
These institutions warn the retail only for one reason… show the financial crisis as a deliberate cover for the next monetary system.
They did it before:
• 2008: Inflated housing/derivatives bubble → crash → bailouts + QE consolidated bank power.
• 2020: REPO crisis + COVID lockdowns crushed money velocity so they could print $6T without instant hyperinflation (Fitts called it). Accelerated digital payments.
Now: Pump AI bubble, then engineer the pop → usher in new system on digital assets infrastructure.
China Has Been Stacking Gold for Nearly Two Years Straight and Hong Kong + Shanghai Just Created a Dollar-Free, Gold Settlement Network. Trump is betting on signing a “crypto check” to wipe out the U.S. debt.
Tether(USDT) minted digital tokens for a decade, amassed more gold than most countries, then finally got audited… the oldest money trick, just rebranded.
China’s new monetary system is gold-backed digital Yuan and America’s new monetary system is Stablecoin economy.
The famous City Of London banker @LordBelgrave had already warned about the planned oil + currency financial crisis at the start of the year. It is now being executed.
Past crashes always paved the way for the next evolution.
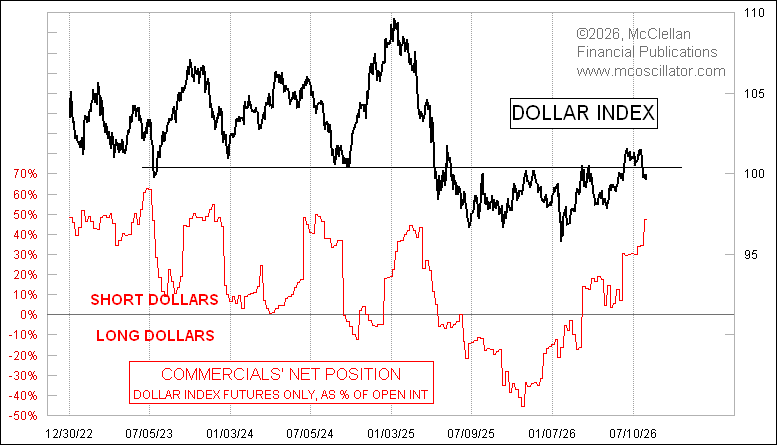
The US Dollar Index (DXY) fell last week on the coordinated US-Japan intervention in the yen. The drop took the DXY back below the 100.50 support/resistance level, marking the move above that level as a failed breakout.
Commercial traders of Dollar Index futures responded this week (COT Report data) by actually upping their collective net short position. If you look back at other price tops in this chart, you may notice that when the commercials do this, adding shorts after the downturn, it means that there is a lot more downturn yet to come for the DXY.
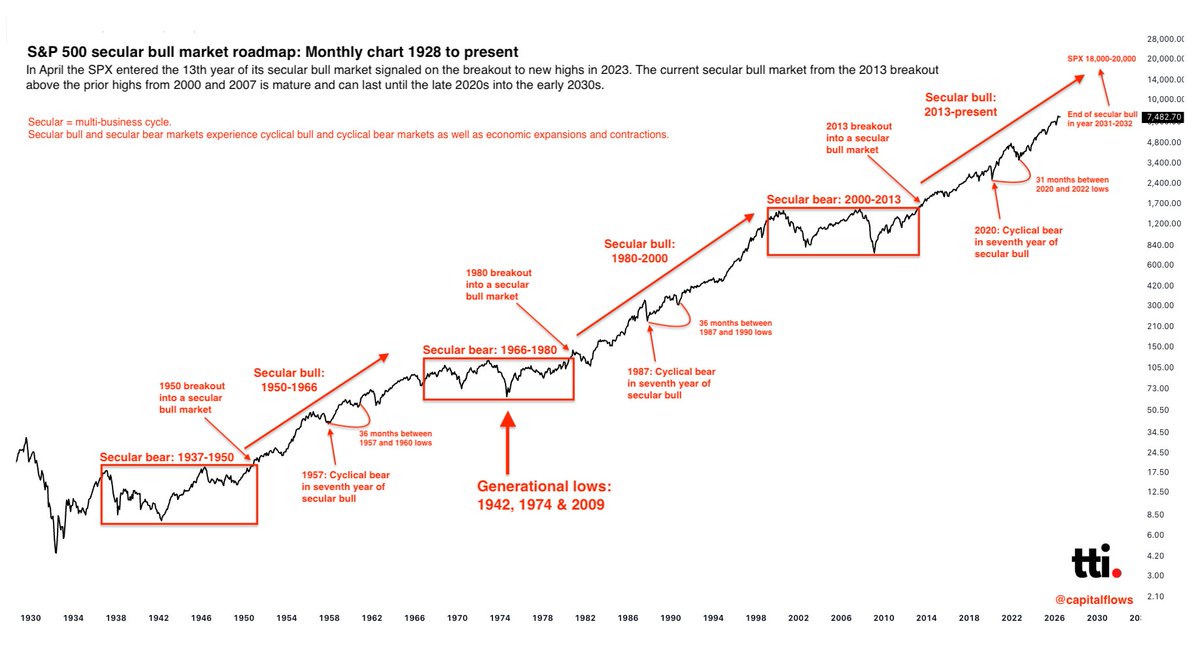
In April the S&P 500 entered year 13 of this secular bull market.
I updated the BoA Global Research chart through 2026.. 100 years of the SPX in a single chart. This is the full walkthrough. Save it if you need it.
But let's start with the obvious.. most people don't know what a secular cycle is. Or that they even exist.
Secular vs Cyclical
A secular cycle is like the season. A cyclical cycle is like the weather. That really is the best way to define each of these.
A cyclical bull or bear typically lasts a couple of years. It's driven by things like the business cycle, earnings, the Fed, positioning, fear and greed, etc.
A secular bull or bear lasts decades.. typically 15-20 years. And it's driven by something way, way bigger. We'll cover that in a second.
Why does the difference matter? Because similar events can have drastically different outcomes depending on which secular cycle we're in.
Take the GFC for example.. we were 7 years into a secular bear market when in late 2007 the largest recession since the Great Depression hit. It took the market 5 years (2008-2013) to get back to all-time highs.
Then look at Covid. We were 7 years into a secular bull market when arguably the most catastrophic economic event in modern history hit. It took the market 6 months to get back to all-time highs.
Same type of event. Different secular environment. Very different outcome. V-shaped recovery baby.
Let's talk about what makes a secular bull market
Go back to the chart and look at the three secular bull markets represented by the up arrows. What do you think they had in common?
First off, a generational technology wave that lifted productivity across the whole economy. Not a single product but the entire tech and innovation cycle was firing off hundreds, maybe thousands of things that changed how everything got done.
Secondly, a starting point where stocks were hated.. and cheap. Secular bull markets are born at the end of secular bear markets, when basically everyone had given up on the market. Many of you remember how bad it felt in 2010 to be buying stocks. I remember.
Lastly, easy money.. it's all about credit. Are banks lending? Is money flowing into businesses, homes, new projects? Bessent says yes!
Let's dive deeper..
1950 to 1966. The postwar rebuild.. highways, suburbs, television, a booming middle class. And stocks started dirt cheap, because everyone who lived through 1929 wanted nothing to do with them. The Dow went from around 200 to nearly 1,000 (375%).
1980 to 2000. Inflation falling from double digits to 3%. Credit expanding for two straight decades.. every year it got easier to borrow, build, and buy. Then the PC, and then the internet. The S&P went from about 100 at the 1982 low to over 1,500 at the top (1,400%).
2013 to today. Mobile, cloud, and now AI.. plus a financial system that spent a decade after 2008 being repaired with the cheapest money in history. The S&P has gone from around 1,500 to 7,500 ('only' 395%).
Notice what kicks each one off on the chart. Not a good year. Not a Fed cut. A breakout above the highs secular bear market highs.
- 1950 broke the 1937 highs.
- 1980 broke the 1966 highs.
- 2013 broke the 2000 and 2007 highs.
Thank you for agreeing what constitutes the beginning of a secular bull market. 😀
So what breaks a secular bull market?
It's not always a crash.. but more so an excess of whatever powered the secular bull cycle to begin with.
The '60s secular cycle didn't end in a bubble and a crash. Two decades of post war spend showed up as inflation and then rates rose for the next 15 years straight.
The easy money was over. Just ask Vlocker. He had a hell of a time fixing inflation directly caused by the previous secular bull.
The '00s however did bubble into a blow up. The internet was a real thing (Hello??) but the market paid for 30 years of the future over the course of 5-10 years.
Valuations went nuts.. funded by a spending boom that culminated in a blow up. But not before going parabolic (NDX rose 1,000% from '95 to '00) and taking a billion dollars from Druckenmiller.
"I didn't learn anything because I knew I shouldn't have shorted the end of a secular bull market but did it anyway." - Druckenmiller probably
Secular bull markets don't end because they're 'too old' or scary headlines. They die when euphoria meets a catalyst that ends the monetary regime we're in. Inflation, credit, that kinda thing.
Fun fact.. every seven years has marked a time to buy
Look at 1957, 1987, and 2020.
Each year represented a cyclical bear in the seventh year of a secular bull.
'57 was a recession, '87 was black Monday, and '20 was a global pandemic.
Those god damn market makers planned it.. right?
Probably not. It has a lot to do with the secular bull market maturing. The crowd is no longer fearful from the previous secular bear. Leverage has crept back into the system. Economy probably running hot with a Fed trying to manage it.
So the market kicks everyone in the face. Shit happens.
But here's where it gets interesting: the 1957 bear market saw new all-time highs by 1958, the 1987 crash (worst day in modern history as I'm told) saw new highs within 2 years and 2020 was the fastest 30% decline ever.. and new highs within 6 months.
Cyclical bears are for BUYING when you're in a secular bull. Don't give into the DOOM!!
Markets move because of one reason.. liquidity
You may be asking yourself.. why do these crashes get bought and ultimately resolve in new all-time highs.. every time?
Cash. Rules. Everything. Around Me. CREAM.
.. It's because of liquidity.
Every one of these cyclical bears ended the exact same way.. money became 'easy' again.
- 1958 the fed cut rates in half due to a recession
- 1987 the fed flooded the system with liquidity in under 24 hours due to a blow up
- 2020 the fed initiated the largest QE measure ever due to.. well, the whole world stopping
The easiest way to think about this is..
Cyclical trends are set by the flow of money over months. Secular trends are set by the direction of money over years and decades.
A cyclical bear inside of a secular bull isn't going to break the long term uptrend. It's more than likely just a pause before the next wave of easy money.
But the corrections do shake out the majority of speculators, reset leverage across the market, forces policy to ease.. and then the markets just keep on heading higher.
So where are we? And where are we headed..
We're in year 13. Not early, but not particularly late by historical standards.
The last two secular bull cycles ran 16 and 20 years which gives the current cycle room to run into the late 2020s or early 2030s as long as Warsh and Bessent stick to focusing on the growth aspect of their supply side framework (they will, have faith).
Remember secular bull cycles end when euphoria meets regime change in money.. so ask yourself these questions:
1. Do we have generational euphoria with valuations that make every prior peak look quaint and a public that can't imagine losing the way it did in 2000? Not yet.
2. Is inflation taking off or credit drying up for years at a time.. the way it did in 1966 or 2000? Not yet.
3. Has Ray Dalio finally admitted that the US is going to beat China? Not yet.
Until those conditions are met, we're likely not at the top of this cycle yet. But there's one more VERY VALUABLE precedent that most people (other than me) fail to talk about all the time..
The final years of a secular bull market have historically been the best years of the entire cycle.
From 1995 to 2000.. the last 5 years of the last secular bull market.. the S&P 500 nearly tripled. The NASDAQ gained 1,000%. HELLO.
Let me be clear about one thing.. I'm not calling for a straight line up in the markets through the end of this secular cycle.
There will be pull backs, corrections, and maybe another cyclical bear (probably not but maybe) before this all ends. Might even be a nasty one.
But if the historical pattern holds.. we have a lot more to go before this is all over. Before another parabolic move into a bubble pop.
Besides.. you have no idea how lucky you will be if we DO get a Dot Com bubble ending. NASDAQ GAINED 1,000% IN FIVE YEARS.
In all seriousness, the updated BoA roadmap points to SPX at 18,000 to 20,000 by the early 2030's (my addition) under the assumption that we do end up running (very) hot into the end of this cycle.
A more conservative approach where the SPX averages 10-12% per year (rarely does) puts us at 12,000-13,000 by 2031-2032. Another 50-60% move higher.
I think the roadmap is right and everyone else who cries all the time on X is mostly wrong. Mostly because most people are wrong all the time in markets. Most. So yeah.
Now you know what a secular bull and bear cycle are, what drives them, what ends them, and where we may be. It's up to you to decide how you want to play the ending of this current secular cycle.
I think this stuff matters. A lot. So much that I track institutional capital flows on a global and market basis. Where big banks and professional money managers are parking their cash. Which sectors, industries, stocks, etc. The best trades tend to come from the stuff those guys wanna own.
If you want to read my thoughts every morning, sign up here for free: https://t.co/Mmkyk4UPY2
I write about capital flow, market cycles, sector rotations, hot tipz on stocks, and whatever else I think is cool.
Feel free to reply back to any of the newsletters and talk shop. The best ideas come from back and forth's.
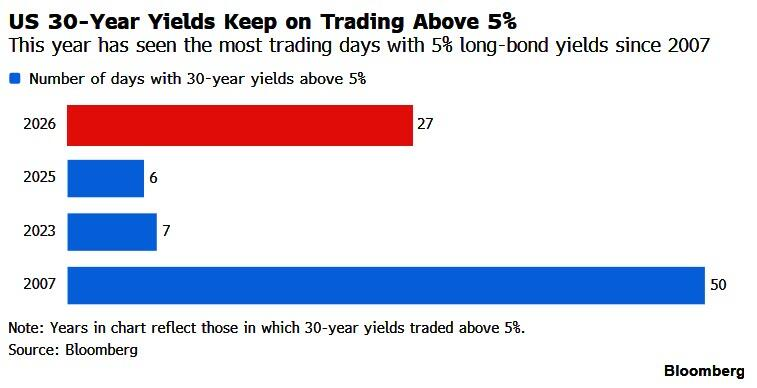
🚨US 30-year Treasury yields are stuck above 5%, longer than at any point since the Financial Crisis:
The US 30-year Treasury yield has traded above 5% for 27 trading days so far in 2026, including the last 12 in a row.
This is already the longest streak since 2007, when the 30-year yield traded above 5% on 50 trading days.
This makes today's move even more significant. The Fed's policy rate is currently ~150 basis points lower than it was in 2007, meaning investors are demanding a larger premium to hold 30-year Treasuries than they did heading into the subprime crisis.
Meanwhile, the Treasury market has expanded to $39.5 trillion, up from $8.8 trillion in 2007. US debt now exceeds 120% of GDP, while annual interest costs have surpassed $1 trillion.
At the same time, over $500 billion in AI-related corporate debt issuance is competing with the Treasury for the same pool of long-term capital.
The real, inflation-adjusted 30-year yield has also surged ~50bps this year toward 3%, a level last seen in 2008.
With Treasury borrowing accelerating and AI-related debt issuance remaining elevated, the competition for long-term capital is only intensifying.
If Treasury supply continues to overwhelm demand, a move toward 6% on the 30-year Treasury may not be far out of reach.
Hot IPOs can be exciting - but chasing them at any price is not a sound investment strategy.
SpaceX is already down 46% from its peak and the wave of selling from early investors and insiders hasn’t even begun.
History suggests volatility's quietest days may be ending. Learn why August has repeatedly marked the beginning of $VIX's seasonal climb and how traders can position for it.
🔗https://t.co/y6N9a2PDFX
An international fleet of tall ships arrived on the shores of New Jersey to celebrate America’s 250th Anniversary
It’s like going back in time
It was a historical location gathering, "Nearly 250 years ago, it was here at Sandy Hook that George Washington's army drove the British from New Jersey” - Gov. Mikie Sherrill, a former naval officer
“It was from this day that the last British ships of the Revolutionary War departed."
The site is also home to America’s oldest continuously lit lighthouse, which has guided maritime navigators since 1764