Surely you don’t want to be a safe haven for online bullying? Feel like more needs to be done and no, me just blocking the accounts I’m don’t have to see it is not the right outcome.
@TikTokSupport
Sorry to do this publicly, but I’m not sure how to escalate this. We have a student who has set up an account with the sole purpose of mocking (bullying) other students and staff. I’ve reported it but apparently it doesn’t breach your community guidelines! Wow!
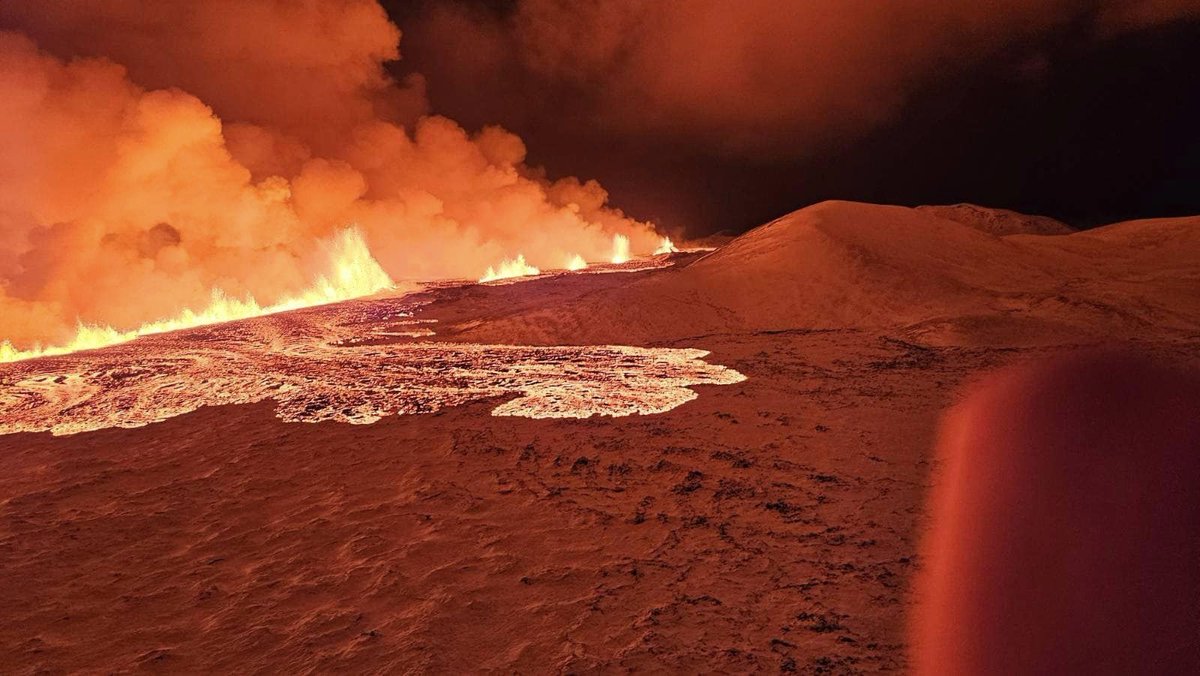
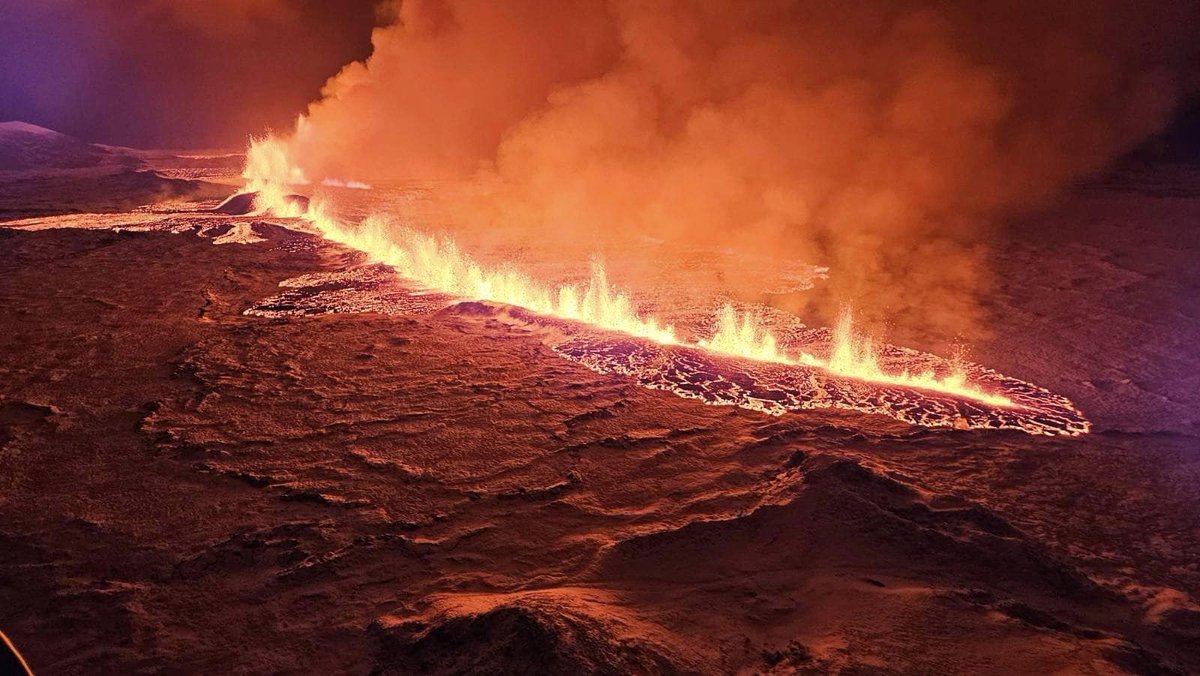
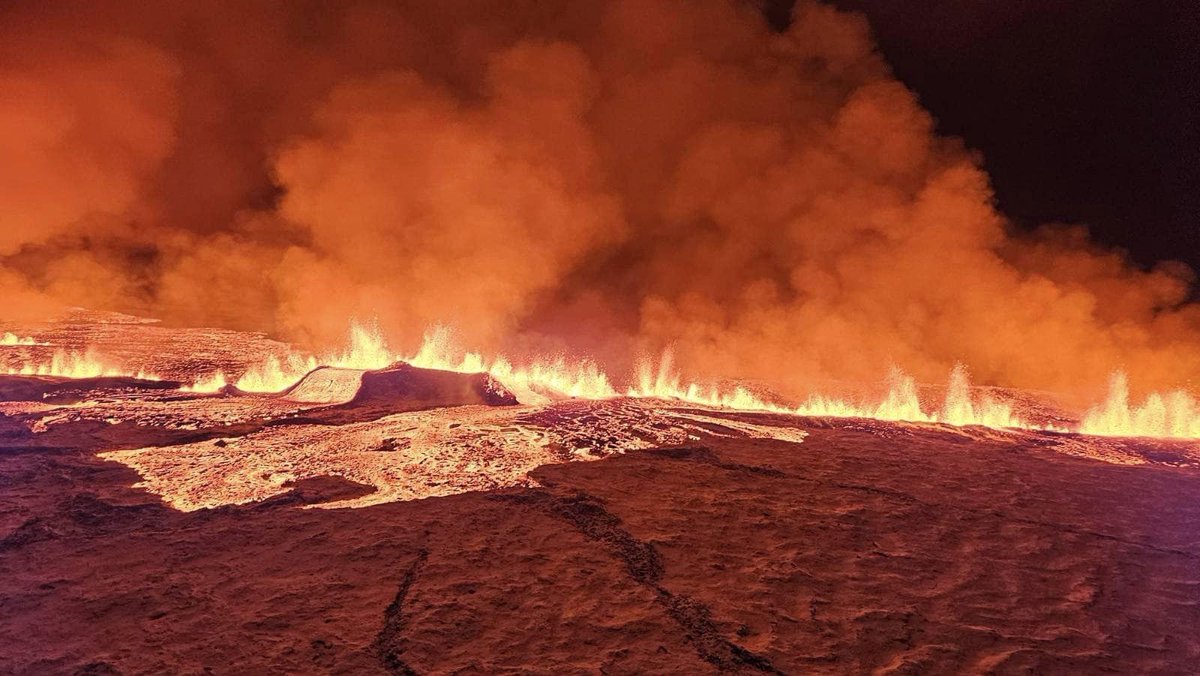
Beautiful picture of the erupting fissure. It looks like the 3,5 km fissure is on a northern sloping area thus the lava is flowing towards the north, which is good news for the people of Grindavík. #icelandvolcano 📷Almannavarnir
The wettest place in the world, Mawsynram, India just recorded a mind boggling 39.51 inches (1003.6 mm) of rain in the last 24 hours.
These are what the waterfalls in the area look like.
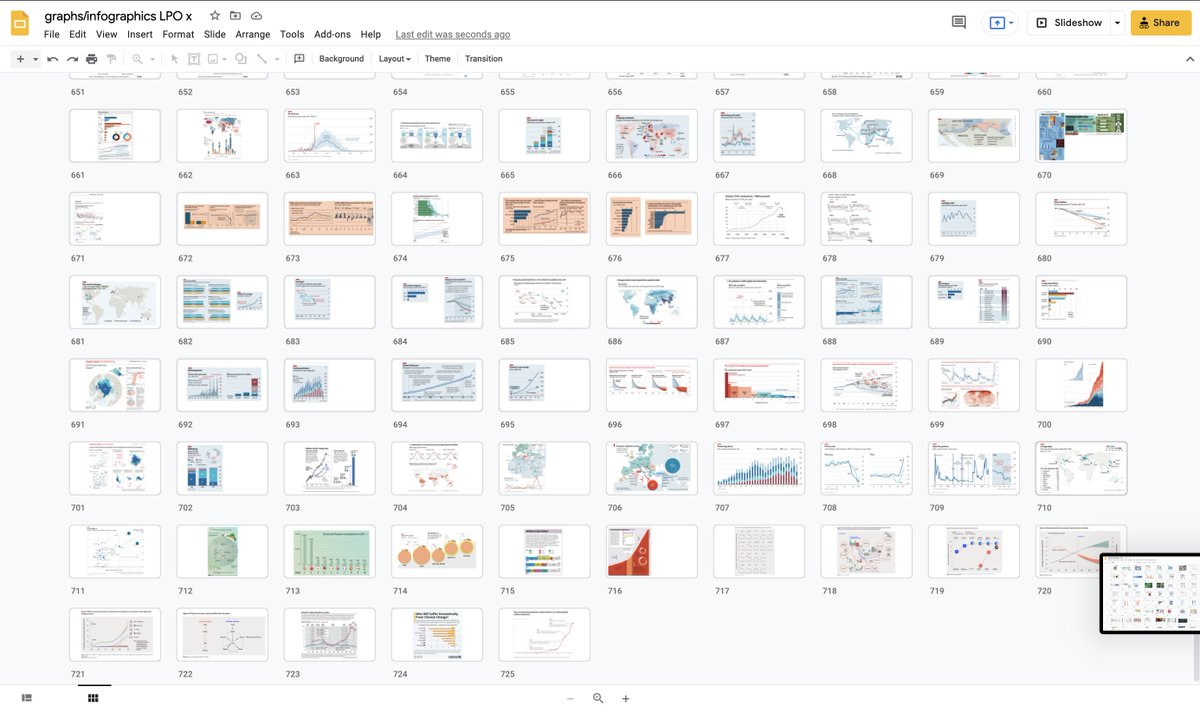
I have collected relevant graphs/maps/infographics for KS3-5 geography for a year or so now. Now over 700+ to use. One of my go to resources when planning lessons:
https://t.co/72CwLPrxPY
#geographyteacher
George Hadley was born on 12 February 1685. A physicist & meteorologist, his theory describes a global circulation pattern now known as the Hadley cell that is responsible for the trade winds. Read about it & its role within global atmospheric circulation https://t.co/Niq0qwMUyn
We’re looking for a new HOD for our department from Sept. Leafy Surrey. School is awesome (biased) with aspirations for even more awesomeness. 80% of students pick Geography at GCSE. It’s the strongest department in the school. Geog students attain in the top 5% of the country.
Animated map shows whether a country does more trade with the US or with China. You can see the shifting "alliances" of the US-China Trade War between 1980 and 2018. Have a close look at how African nations are tilting towards China. Source: https://t.co/Y1sfHyTJAn
The Richter Scale was invented in 1935 as a mathematical device to compare the size of earthquakes. Using a seismometer to detect vibrations caused by an #earthquake, the magnitude can be measured using the Richter scale, which is numbered 1-10... #geographyteacher#geography
Nice write-up of the project marking 7 million available images at BBC News - The 'map nerds' who are building a national archive
https://t.co/MWXI4BrxWJ
The Earth's most common elevation is sea level - and yet, most of Earth's surface lies below sea level - FAR below sea level, at 4-6 km depth.
Why?
The answer is a combination of #platetectonics and Earth's oceans. 1/9
#tectoplot
Here is a map animation for CO2 emissions from 1970-2016 by Ben Hennig @geoviews, perfect for starting a lesson on climate change or COP26 or GHG emissions https://t.co/Wz2QtkKahU